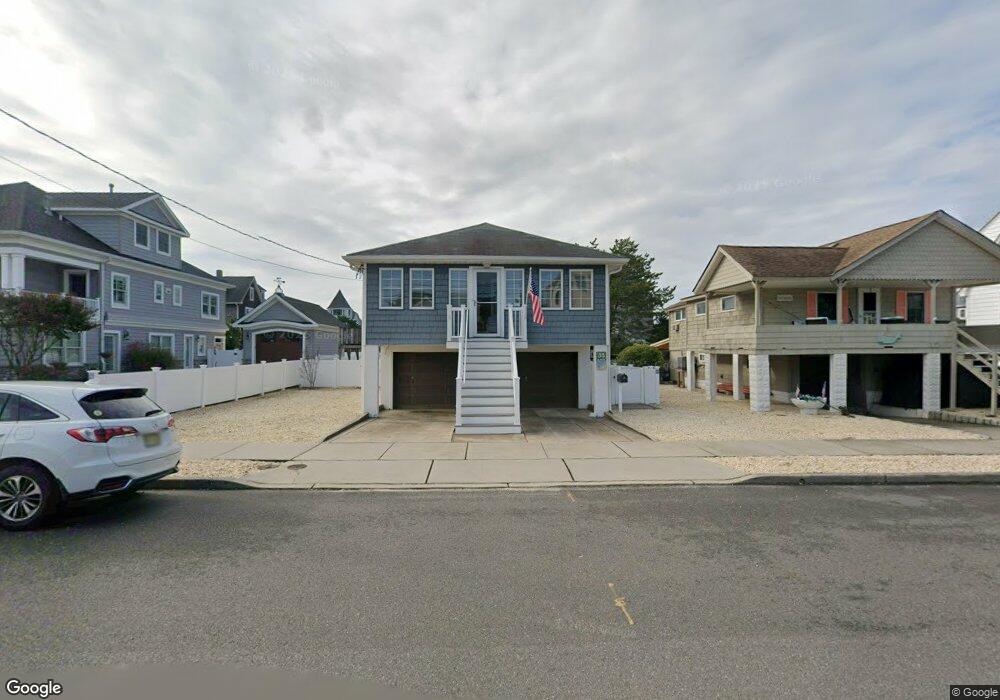
31 7th Ln Unit 33 Seaside Park, NJ 08752
Estimated Value: $1,009,000 - $1,343,000
4
Beds
2
Baths
864
Sq Ft
$1,291/Sq Ft
Est. Value
About This Home
This home is located at 31 7th Ln Unit 33, Seaside Park, NJ 08752 and is currently estimated at $1,115,524, approximately $1,291 per square foot. 31 7th Ln Unit 33 is a home located in Ocean County with nearby schools including Central Regional Middle School and Central Regional High School.
Ownership History
Date
Name
Owned For
Owner Type
Purchase Details
Closed on
Jun 27, 2017
Sold by
Hepworth Trust
Bought by
Black Charles K and Black Wendy S
Current Estimated Value
Purchase Details
Closed on
Aug 2, 2013
Sold by
Reuben F Hepworth Family Trust and Hepworth William S
Bought by
Reuben F Hepworth Ft Credit Shelter Trus and Hepworth William S
Purchase Details
Closed on
Dec 15, 2010
Sold by
Hepworth Reuben and Hepworth Marion
Bought by
Reuben F Hepworth Family Trust and Hepworth William S
Create a Home Valuation Report for This Property
The Home Valuation Report is an in-depth analysis detailing your home's value as well as a comparison with similar homes in the area
Home Values in the Area
Average Home Value in this Area
Purchase History
| Date | Buyer | Sale Price | Title Company |
|---|---|---|---|
| Black Charles K | $670,000 | Westcor Land Title | |
| Reuben F Hepworth Ft Credit Shelter Trus | -- | None Available | |
| Reuben F Hepworth Family Trust | -- | None Available |
Source: Public Records
Tax History Compared to Growth
Tax History
| Year | Tax Paid | Tax Assessment Tax Assessment Total Assessment is a certain percentage of the fair market value that is determined by local assessors to be the total taxable value of land and additions on the property. | Land | Improvement |
|---|---|---|---|---|
| 2025 | $10,701 | $654,100 | $550,000 | $104,100 |
| 2024 | $10,524 | $654,100 | $550,000 | $104,100 |
| 2023 | $10,152 | $654,100 | $550,000 | $104,100 |
| 2022 | $10,152 | $654,100 | $550,000 | $104,100 |
| 2021 | $9,936 | $654,100 | $550,000 | $104,100 |
| 2020 | $9,831 | $654,100 | $550,000 | $104,100 |
| 2019 | $9,726 | $654,100 | $550,000 | $104,100 |
| 2018 | $9,092 | $654,100 | $550,000 | $104,100 |
| 2017 | $9,229 | $654,100 | $550,000 | $104,100 |
| 2016 | $8,332 | $654,100 | $550,000 | $104,100 |
| 2015 | $8,705 | $654,100 | $550,000 | $104,100 |
| 2014 | $8,306 | $654,100 | $550,000 | $104,100 |
Source: Public Records
Map
Nearby Homes
- 809 S Ocean Ave
- 525 SW Central Ave
- 117 7th Ave
- 106 2nd Ave Unit 1
- 45 Arlington Way
- 45N Arlington Way Unit 112
- 53 C St
- 301 N Ocean Ave
- 108 Midway Ave
- 2200 S Ocean Ave Unit 304
- 19 9th Ln
- 210 Midway Ave
- 1533 S Bayview Ave
- 39 20th Ave
- 58 I St
- 66 I St
- 12 I St
- 12 23rd Ave
- 1005 N Ocean Ave
- 111 K St Unit A2