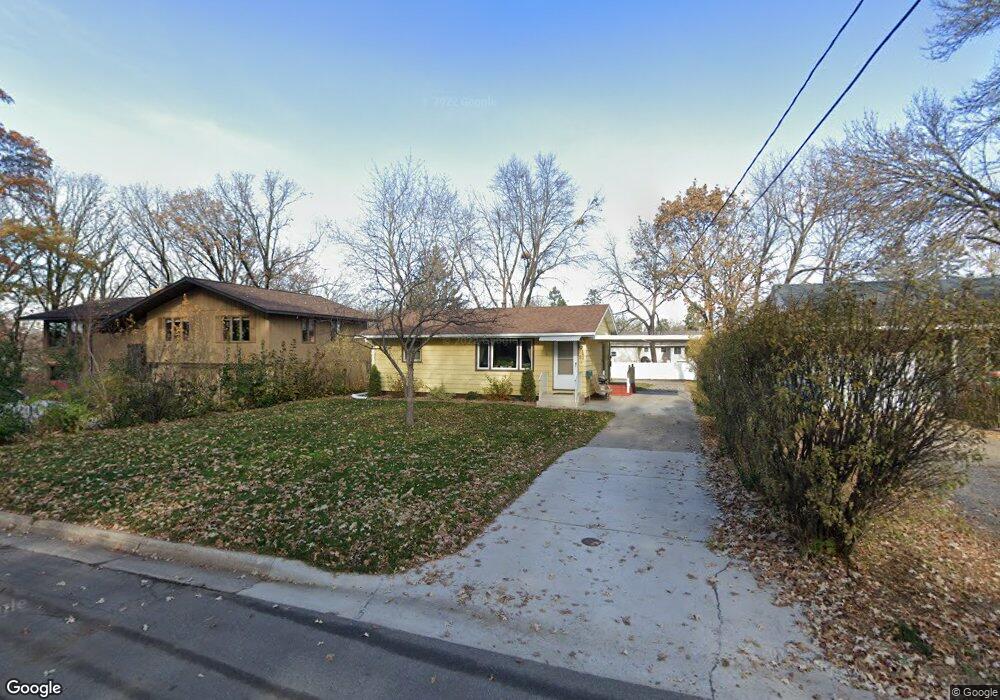
31 8th St S Sauk Rapids, MN 56379
Estimated Value: $213,008 - $240,000
3
Beds
2
Baths
768
Sq Ft
$289/Sq Ft
Est. Value
About This Home
This home is located at 31 8th St S, Sauk Rapids, MN 56379 and is currently estimated at $221,752, approximately $288 per square foot. 31 8th St S is a home located in Benton County with nearby schools including Mississippi Heights Elementary School, Sauk Rapids-Rice Middle School, and Sauk Rapids-Rice Senior High School.
Ownership History
Date
Name
Owned For
Owner Type
Purchase Details
Closed on
Jun 30, 2011
Sold by
Johnson Diane L
Bought by
Decker Stephen W
Current Estimated Value
Home Financials for this Owner
Home Financials are based on the most recent Mortgage that was taken out on this home.
Original Mortgage
$105,300
Outstanding Balance
$72,852
Interest Rate
4.63%
Mortgage Type
New Conventional
Estimated Equity
$148,900
Create a Home Valuation Report for This Property
The Home Valuation Report is an in-depth analysis detailing your home's value as well as a comparison with similar homes in the area
Home Values in the Area
Average Home Value in this Area
Purchase History
| Date | Buyer | Sale Price | Title Company |
|---|---|---|---|
| Decker Stephen W | $119,900 | -- |
Source: Public Records
Mortgage History
| Date | Status | Borrower | Loan Amount |
|---|---|---|---|
| Open | Decker Stephen W | $105,300 |
Source: Public Records
Tax History Compared to Growth
Tax History
| Year | Tax Paid | Tax Assessment Tax Assessment Total Assessment is a certain percentage of the fair market value that is determined by local assessors to be the total taxable value of land and additions on the property. | Land | Improvement |
|---|---|---|---|---|
| 2025 | $1,924 | $184,900 | $28,600 | $156,300 |
| 2024 | $1,902 | $176,000 | $28,600 | $147,400 |
| 2023 | $1,810 | $174,600 | $28,600 | $146,000 |
| 2022 | $1,644 | $155,200 | $26,000 | $129,200 |
| 2021 | $1,490 | $132,900 | $26,000 | $106,900 |
| 2018 | $1,340 | $85,500 | $18,983 | $66,517 |
| 2017 | $1,340 | $79,300 | $18,545 | $60,755 |
| 2016 | $1,318 | $105,100 | $25,000 | $80,100 |
| 2015 | $1,322 | $71,200 | $17,889 | $53,311 |
| 2014 | -- | $67,100 | $17,529 | $49,571 |
| 2013 | -- | $68,200 | $17,632 | $50,568 |
Source: Public Records
Map
Nearby Homes
- 1715 Hillcrest Rd
- 608 Summit Ave S
- 1804 8th Ave S
- 1803 8th Ave S
- 2021 Hillcrest Dr
- 1415 7th Ave N
- 1403 8th Ave N
- 1409 3rd Ave S
- 3300 321st St
- 1340 9th Ave N
- 3322 321st St
- 112 Summit Ave S
- 1021 5th St S
- 1253 7th Ave N
- 2016 Forest Ct
- 2024 Forest Ct
- 1 Skyview Dr
- 117 6th Ave N
- 1209 Millstone Ct
- 100 9th Ave S