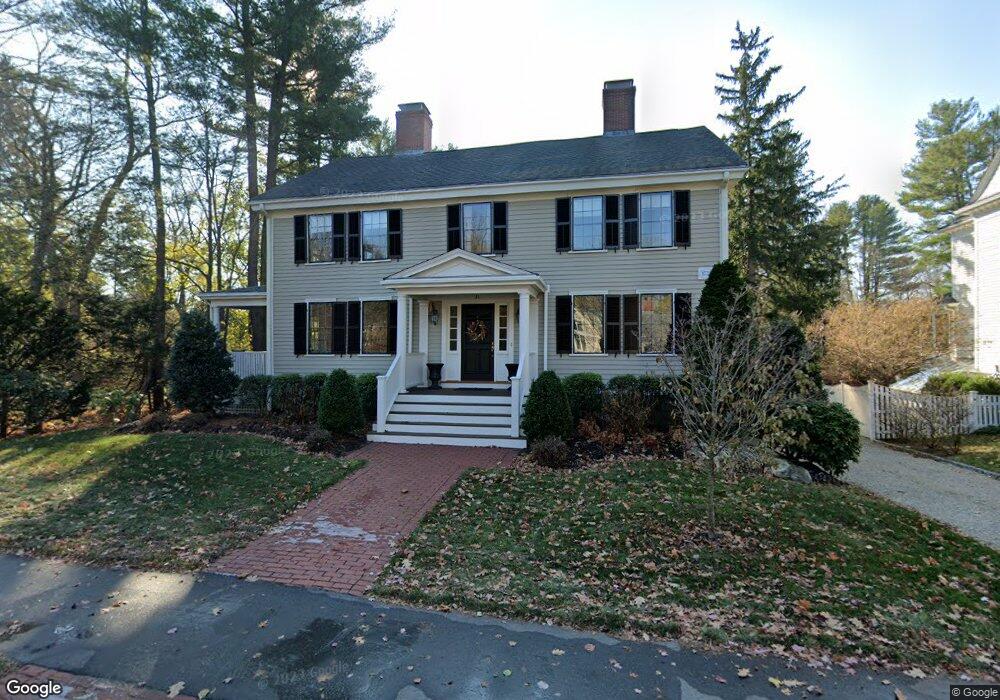
31 Abbott Rd Wellesley Hills, MA 02481
Wellesley Hills NeighborhoodEstimated Value: $2,205,000 - $3,201,000
1
Bed
4
Baths
800
Sq Ft
$3,465/Sq Ft
Est. Value
About This Home
Charming carriage house apartment in perfect location. One block from commuter rail. Walking distance to shops, restaurants, Babson College and more.
Furnished one bedroom with walk in closet, galley kitchen with granite countertops.
Lease length is flexible
Available December 1.
Single, female occupancy.
Ownership History
Date
Name
Owned For
Owner Type
Purchase Details
Closed on
Dec 10, 2010
Sold by
Claflin Mark J
Bought by
Claflin Mark J and Claflin Nancy L
Current Estimated Value
Home Financials for this Owner
Home Financials are based on the most recent Mortgage that was taken out on this home.
Original Mortgage
$1,072,200
Outstanding Balance
$709,102
Interest Rate
4.24%
Mortgage Type
Purchase Money Mortgage
Estimated Equity
$2,062,549
Purchase Details
Closed on
Jul 2, 2001
Sold by
Peabody James L
Bought by
Claflin Mark J and Claflin Nancy L
Home Financials for this Owner
Home Financials are based on the most recent Mortgage that was taken out on this home.
Original Mortgage
$552,000
Interest Rate
7.14%
Mortgage Type
Purchase Money Mortgage
Create a Home Valuation Report for This Property
The Home Valuation Report is an in-depth analysis detailing your home's value as well as a comparison with similar homes in the area
Home Values in the Area
Average Home Value in this Area
Purchase History
| Date | Buyer | Sale Price | Title Company |
|---|---|---|---|
| Claflin Mark J | -- | -- | |
| Claflin Mark J | $690,000 | -- |
Source: Public Records
Mortgage History
| Date | Status | Borrower | Loan Amount |
|---|---|---|---|
| Open | Claflin Mark J | $1,072,200 | |
| Previous Owner | Claflin Mark J | $552,000 |
Source: Public Records
Property History
| Date | Event | Price | List to Sale | Price per Sq Ft |
|---|---|---|---|---|
| 09/01/2024 09/01/24 | For Rent | $2,400 | -- | -- |
Tax History Compared to Growth
Tax History
| Year | Tax Paid | Tax Assessment Tax Assessment Total Assessment is a certain percentage of the fair market value that is determined by local assessors to be the total taxable value of land and additions on the property. | Land | Improvement |
|---|---|---|---|---|
| 2025 | $21,783 | $2,119,000 | $1,043,000 | $1,076,000 |
| 2024 | $19,248 | $1,849,000 | $998,000 | $851,000 |
| 2023 | $18,744 | $1,637,000 | $871,000 | $766,000 |
| 2022 | $17,672 | $1,513,000 | $720,000 | $793,000 |
| 2021 | $17,778 | $1,513,000 | $720,000 | $793,000 |
| 2020 | $17,490 | $1,513,000 | $720,000 | $793,000 |
| 2019 | $17,158 | $1,483,000 | $690,000 | $793,000 |
| 2018 | $17,065 | $1,428,000 | $662,000 | $766,000 |
| 2017 | $16,836 | $1,428,000 | $662,000 | $766,000 |
| 2016 | $17,000 | $1,437,000 | $651,000 | $786,000 |
| 2015 | $16,300 | $1,410,000 | $623,000 | $787,000 |
Source: Public Records
Map
Nearby Homes
- 28 Clovelly Rd
- 29 Rockland St
- 7 Cliff Rd
- 25 Shaw Rd
- 26 Edmunds Rd
- 6 Oakland Cir
- 42 Edmunds Rd
- 20 Oakland Street Front
- 54 Colburn Rd
- 32 Twitchell St
- 93 Seaver St
- 46 Lincoln Rd
- 94 Rice St
- 14 Twitchell St
- 32 Kingsbury St Unit A
- 12 Bird Hill Ave
- 52 Valley Rd
- 99 Old Colony Rd
- 32 Donizetti St
- 2 Longfellow Rd