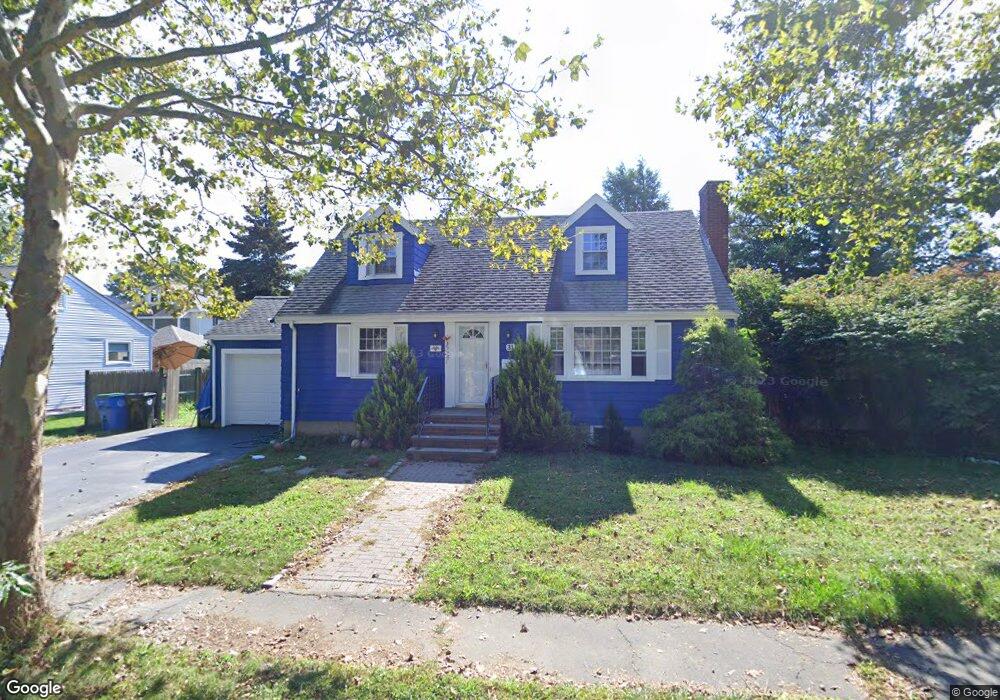
31 Bacon Rd Belmont, MA 02478
Cushing Square NeighborhoodEstimated Value: $1,381,000 - $1,584,654
3
Beds
2
Baths
1,434
Sq Ft
$1,020/Sq Ft
Est. Value
About This Home
This home is located at 31 Bacon Rd, Belmont, MA 02478 and is currently estimated at $1,462,414, approximately $1,019 per square foot. 31 Bacon Rd is a home located in Middlesex County with nearby schools including Mary Lee Burbank Elementary School, Winthrop L Chenery Middle School, and Belmont High School.
Ownership History
Date
Name
Owned For
Owner Type
Purchase Details
Closed on
Oct 24, 2008
Sold by
Hayward Virginia M
Bought by
Sen Kabir J and Sen Rebecca L F
Current Estimated Value
Home Financials for this Owner
Home Financials are based on the most recent Mortgage that was taken out on this home.
Original Mortgage
$545,000
Outstanding Balance
$353,779
Interest Rate
5.94%
Mortgage Type
Purchase Money Mortgage
Estimated Equity
$1,108,635
Create a Home Valuation Report for This Property
The Home Valuation Report is an in-depth analysis detailing your home's value as well as a comparison with similar homes in the area
Home Values in the Area
Average Home Value in this Area
Purchase History
| Date | Buyer | Sale Price | Title Company |
|---|---|---|---|
| Sen Kabir J | $545,000 | -- | |
| Sen Kabir J | $545,000 | -- |
Source: Public Records
Mortgage History
| Date | Status | Borrower | Loan Amount |
|---|---|---|---|
| Open | Sen Kabir J | $545,000 | |
| Closed | Sen Kabir J | $545,000 |
Source: Public Records
Tax History Compared to Growth
Tax History
| Year | Tax Paid | Tax Assessment Tax Assessment Total Assessment is a certain percentage of the fair market value that is determined by local assessors to be the total taxable value of land and additions on the property. | Land | Improvement |
|---|---|---|---|---|
| 2025 | $15,206 | $1,335,000 | $834,000 | $501,000 |
| 2024 | $15,206 | $1,440,000 | $1,039,000 | $401,000 |
| 2023 | $14,241 | $1,267,000 | $907,000 | $360,000 |
| 2022 | $13,467 | $1,186,000 | $852,000 | $334,000 |
| 2021 | $13,467 | $1,167,000 | $888,000 | $279,000 |
| 2020 | $12,639 | $1,149,000 | $870,000 | $279,000 |
| 2019 | $11,098 | $951,000 | $647,000 | $304,000 |
| 2018 | $8,906 | $981,000 | $588,000 | $393,000 |
| 2017 | $11,764 | $927,000 | $539,000 | $388,000 |
| 2016 | $11,618 | $925,000 | $539,000 | $386,000 |
| 2015 | $10,759 | $834,000 | $449,000 | $385,000 |
Source: Public Records
Map
Nearby Homes
- 73 Foster Rd Unit 2
- 276 Belmont St Unit 1
- 30 Unity Ave Unit 30
- 36 Madison St
- 105 Watson Rd
- 147 Langdon Ave Unit 149
- 10 Marlboro St Unit 1
- 133 Hillside Rd
- 163 Belmont St
- 118 Blanchard Rd
- 161 Cushing St
- 56-58 Edgecliff Rd
- 87 Templeton Pkwy Unit 3
- 16 Ericsson St
- 81 Winsor Ave
- 48 Concord Ave
- 95 Cushing St
- 4 Merrill Ave
- 25 Francis St Unit 2
- 25 Francis St Unit 1