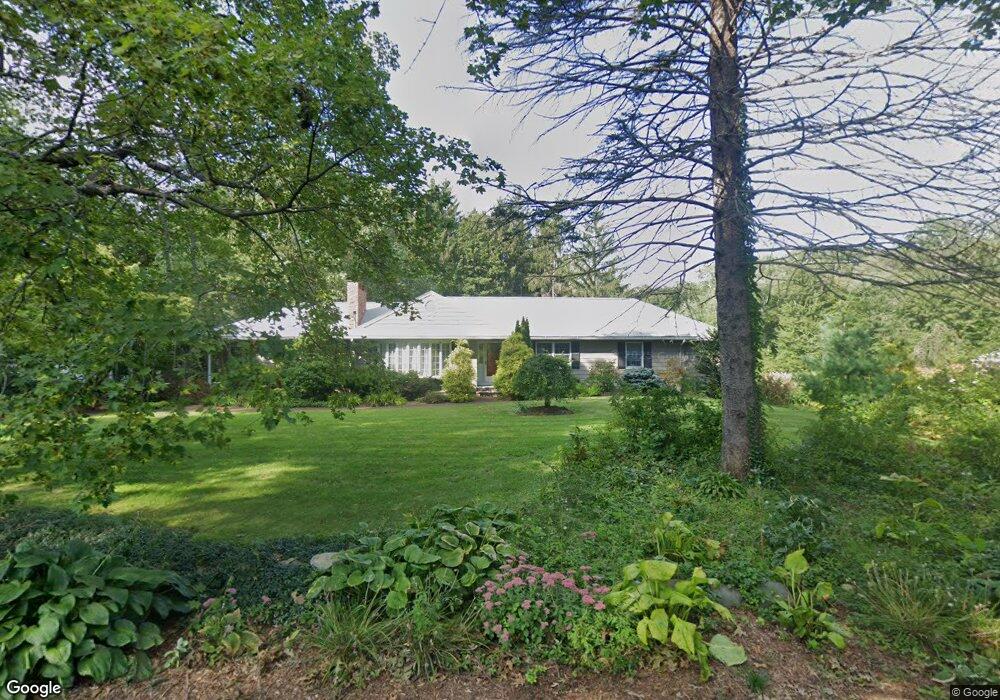
31 Bannister Rd Andover, MA 01810
Ballardvale NeighborhoodEstimated Value: $1,095,000 - $1,358,000
3
Beds
3
Baths
2,414
Sq Ft
$519/Sq Ft
Est. Value
About This Home
This home is located at 31 Bannister Rd, Andover, MA 01810 and is currently estimated at $1,252,885, approximately $519 per square foot. 31 Bannister Rd is a home located in Essex County with nearby schools including South Elementary School, Andover West Middle School, and Andover High School.
Ownership History
Date
Name
Owned For
Owner Type
Purchase Details
Closed on
Sep 8, 2004
Sold by
Esten Jennifer
Bought by
Hall Carolyn D and Finlay Gregory W
Current Estimated Value
Home Financials for this Owner
Home Financials are based on the most recent Mortgage that was taken out on this home.
Original Mortgage
$520,000
Interest Rate
6.08%
Mortgage Type
Purchase Money Mortgage
Purchase Details
Closed on
Oct 27, 1994
Sold by
Fontanella John J
Bought by
Starr Jeffrey A
Create a Home Valuation Report for This Property
The Home Valuation Report is an in-depth analysis detailing your home's value as well as a comparison with similar homes in the area
Home Values in the Area
Average Home Value in this Area
Purchase History
We collect this data history from publicly available records. To have your information removed, we recommend requesting removal directly through your county’s website.
| Date | Buyer | Sale Price | Title Company |
|---|---|---|---|
| Hall Carolyn D | $667,000 | -- | |
| Starr Jeffrey A | $256,250 | -- |
Source: Public Records
Mortgage History
We collect this data history from publicly available records. To have your information removed, we recommend requesting removal directly through your county’s website.
| Date | Status | Borrower | Loan Amount |
|---|---|---|---|
| Open | Starr Jeffrey A | $417,000 | |
| Closed | Hall Carolyn D | $520,000 | |
| Previous Owner | Starr Jeffrey A | $75,000 | |
| Previous Owner | Starr Jeffrey A | $79,000 |
Source: Public Records
Tax History
| Year | Tax Paid | Tax Assessment Tax Assessment Total Assessment is a certain percentage of the fair market value that is determined by local assessors to be the total taxable value of land and additions on the property. | Land | Improvement |
|---|---|---|---|---|
| 2025 | $12,015 | $962,000 | $566,300 | $395,700 |
| 2024 | $11,171 | $867,300 | $508,300 | $359,000 |
| 2023 | $10,694 | $782,900 | $457,800 | $325,100 |
| 2022 | $9,913 | $679,000 | $398,100 | $280,900 |
| 2021 | $9,495 | $621,000 | $362,000 | $259,000 |
| 2020 | $9,110 | $606,900 | $353,300 | $253,600 |
| 2019 | $9,038 | $591,900 | $342,800 | $249,100 |
| 2018 | $8,779 | $561,300 | $329,700 | $231,600 |
| 2017 | $8,416 | $554,400 | $323,200 | $231,200 |
| 2016 | $8,238 | $555,900 | $323,200 | $232,700 |
| 2015 | $7,967 | $532,200 | $310,600 | $221,600 |
Source: Public Records
Map
Nearby Homes
- 18 Dale St Unit 9D
- 232 Andover St
- 1 Delisio Dr
- 72 Tewksbury St
- 4 Fairway Dr
- 5 Hillcrest Rd
- 4 Apple Blossom Rd
- 7 Jills Way
- 28 Hearthstone Place
- 56 Sunset Rock Rd
- 5 Powers Rd
- 58 Blanchard St
- 14 Geneva Rd
- 15 Geneva Rd
- 2 Stouffer Cir
- 99 Sunset Rock Rd
- 3 Regency Ridge
- 275 S Main St
- 31 School St Unit 1
- 11 Cuba St
Your Personal Tour Guide
Ask me questions while you tour the home.