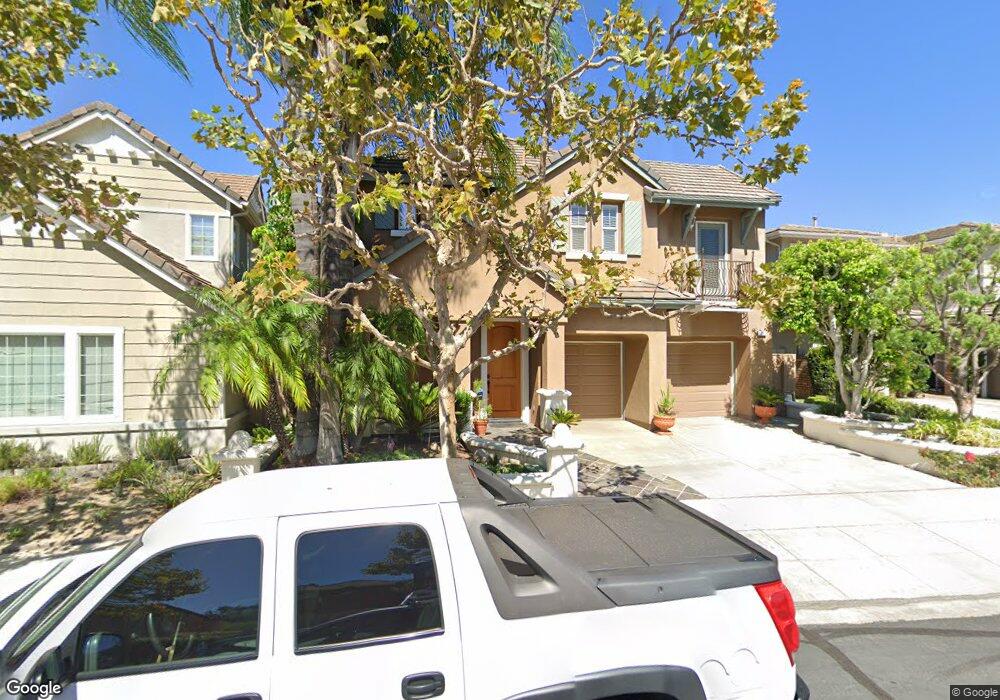
31 Barnstable Way Ladera Ranch, CA 92694
Estimated Value: $1,297,000 - $1,541,000
3
Beds
3
Baths
1,966
Sq Ft
$701/Sq Ft
Est. Value
About This Home
This home is located at 31 Barnstable Way, Ladera Ranch, CA 92694 and is currently estimated at $1,377,885, approximately $700 per square foot. 31 Barnstable Way is a home located in Orange County with nearby schools including Chaparral Elementary School, Ladera Ranch Middle School, and Tesoro High School.
Ownership History
Date
Name
Owned For
Owner Type
Purchase Details
Closed on
Nov 8, 2024
Sold by
Christine Narath Agalzov Revocable Livin and Agalzov Al George
Bought by
Agalzov Al George
Current Estimated Value
Purchase Details
Closed on
Jul 24, 2007
Sold by
Agalzov Christine Narath
Bought by
Agalzov Christine Narath and Christine Narath Agalzov Revocable Livin
Purchase Details
Closed on
Jan 4, 2001
Sold by
Reston Associates Llc
Bought by
Agalzov Christine Narath
Home Financials for this Owner
Home Financials are based on the most recent Mortgage that was taken out on this home.
Original Mortgage
$130,000
Interest Rate
7.65%
Create a Home Valuation Report for This Property
The Home Valuation Report is an in-depth analysis detailing your home's value as well as a comparison with similar homes in the area
Home Values in the Area
Average Home Value in this Area
Purchase History
| Date | Buyer | Sale Price | Title Company |
|---|---|---|---|
| Agalzov Al George | -- | None Listed On Document | |
| Agalzov Al George | -- | None Listed On Document | |
| Agalzov Christine Narath | -- | None Available | |
| Agalzov Christine Narath | $352,000 | Fidelity National Title Ins |
Source: Public Records
Mortgage History
| Date | Status | Borrower | Loan Amount |
|---|---|---|---|
| Previous Owner | Agalzov Christine Narath | $130,000 |
Source: Public Records
Tax History Compared to Growth
Tax History
| Year | Tax Paid | Tax Assessment Tax Assessment Total Assessment is a certain percentage of the fair market value that is determined by local assessors to be the total taxable value of land and additions on the property. | Land | Improvement |
|---|---|---|---|---|
| 2025 | $6,959 | $463,151 | $218,687 | $244,464 |
| 2024 | $6,959 | $454,070 | $214,399 | $239,671 |
| 2023 | $6,871 | $445,167 | $210,195 | $234,972 |
| 2022 | $6,772 | $436,439 | $206,074 | $230,365 |
| 2021 | $6,685 | $427,882 | $202,033 | $225,849 |
| 2020 | $6,570 | $423,495 | $199,961 | $223,534 |
| 2019 | $6,591 | $415,192 | $196,041 | $219,151 |
| 2018 | $6,579 | $407,051 | $192,197 | $214,854 |
| 2017 | $6,652 | $399,070 | $188,428 | $210,642 |
| 2016 | $6,589 | $391,246 | $184,734 | $206,512 |
| 2015 | $6,697 | $385,370 | $181,960 | $203,410 |
| 2014 | $6,750 | $377,822 | $178,396 | $199,426 |
Source: Public Records
Map
Nearby Homes
- 28 Albany St Unit 77
- 16 Skywood St
- 81 Mercantile Way
- 43 Three Vines Ct
- 80 Three Vines Ct
- 30 Three Vines Ct
- 10 Edendale St
- 16 Wyndham St
- 27 Ardennes Dr
- 12 Ardennes Dr
- 22 Kingsway Dr
- 14 Downing St
- 5 Flowerdale Unit 104
- 4 Potters Bend
- 19 Sklar St
- 33 Chadron Cir Unit 120
- 25 Garrison Loop
- 66 Garrison Loop
- 5192 Solance Dr
- 539 Afterglow Dr
- 33 Barnstable Way
- 29 Barnstable Way
- 27 Barnstable Way
- 35 Barnstable Way
- 30 Barnstable Way
- 37 Barnstable Way
- 28 Barnstable Way
- 32 Barnstable Way
- 34 Barnstable Way
- 23 Barnstable Way
- 4 Reston Way
- 21 Barnstable Way
- 1 Reston Way
- 3 Reston Way
- 19 Barnstable Way
- 5 Reston Way
- 8 Reston Way
- 10 Barnstable Way
- 7 Reston Way
- 17 Barnstable Way