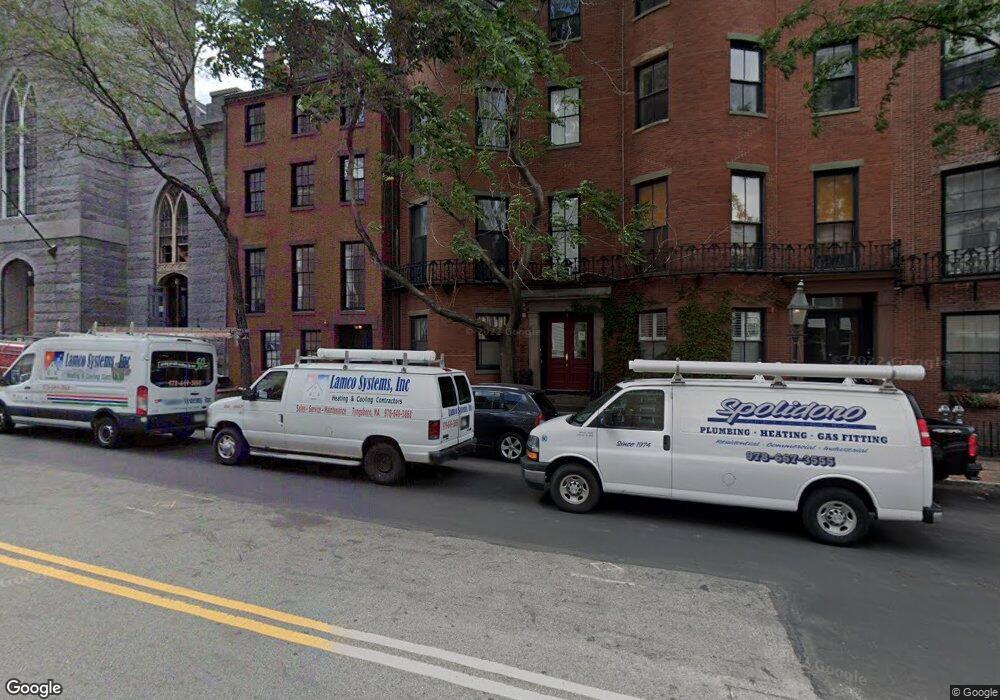
31 Bowdoin St Unit CH Boston, MA 02114
Beacon Hill NeighborhoodEstimated Value: $1,588,308 - $1,640,000
3
Beds
2
Baths
1,352
Sq Ft
$1,195/Sq Ft
Est. Value
About This Home
This home is located at 31 Bowdoin St Unit CH, Boston, MA 02114 and is currently estimated at $1,616,077, approximately $1,195 per square foot. 31 Bowdoin St Unit CH is a home located in Suffolk County with nearby schools including Torit Montessori School, Boston Children's School, and Advent School.
Ownership History
Date
Name
Owned For
Owner Type
Purchase Details
Closed on
Nov 14, 2023
Sold by
Leitch Cathey S Est and Leitch
Bought by
Meaders Phyllis P
Current Estimated Value
Purchase Details
Closed on
Aug 25, 2011
Sold by
Jeon Andrew
Bought by
Leitch Cathey S
Purchase Details
Closed on
Jan 5, 2005
Sold by
Thorgerson Eric J
Bought by
Joen Andrew A
Home Financials for this Owner
Home Financials are based on the most recent Mortgage that was taken out on this home.
Original Mortgage
$610,000
Interest Rate
5.75%
Mortgage Type
Purchase Money Mortgage
Purchase Details
Closed on
Oct 20, 2000
Sold by
Bowdoin St Rt and Baehrend
Bought by
Thorgerson Eric J
Home Financials for this Owner
Home Financials are based on the most recent Mortgage that was taken out on this home.
Original Mortgage
$120,000
Interest Rate
7.88%
Mortgage Type
Purchase Money Mortgage
Create a Home Valuation Report for This Property
The Home Valuation Report is an in-depth analysis detailing your home's value as well as a comparison with similar homes in the area
Home Values in the Area
Average Home Value in this Area
Purchase History
| Date | Buyer | Sale Price | Title Company |
|---|---|---|---|
| Meaders Phyllis P | $1,468,000 | None Available | |
| Meaders Phyllis P | $1,468,000 | None Available | |
| Leitch Cathey S | $950,000 | -- | |
| Leitch Cathey S | $950,000 | -- | |
| Joen Andrew A | $762,500 | -- | |
| Joen Andrew A | $762,500 | -- | |
| Thorgerson Eric J | $680,000 | -- | |
| Thorgerson Eric J | $680,000 | -- |
Source: Public Records
Mortgage History
| Date | Status | Borrower | Loan Amount |
|---|---|---|---|
| Previous Owner | Thorgerson Eric J | $523,750 | |
| Previous Owner | Thorgerson Eric J | $610,000 | |
| Previous Owner | Thorgerson Eric J | $120,000 |
Source: Public Records
Tax History Compared to Growth
Tax History
| Year | Tax Paid | Tax Assessment Tax Assessment Total Assessment is a certain percentage of the fair market value that is determined by local assessors to be the total taxable value of land and additions on the property. | Land | Improvement |
|---|---|---|---|---|
| 2025 | $15,932 | $1,375,800 | $0 | $1,375,800 |
| 2024 | $14,623 | $1,341,600 | $0 | $1,341,600 |
| 2023 | $14,409 | $1,341,600 | $0 | $1,341,600 |
| 2022 | $14,452 | $1,328,300 | $0 | $1,328,300 |
| 2021 | $13,896 | $1,302,300 | $0 | $1,302,300 |
| 2020 | $13,295 | $1,259,000 | $0 | $1,259,000 |
| 2019 | $12,515 | $1,187,412 | $0 | $1,187,412 |
| 2018 | $11,740 | $1,120,200 | $0 | $1,120,200 |
| 2017 | $11,298 | $1,066,835 | $0 | $1,066,835 |
| 2016 | $11,735 | $1,066,835 | $0 | $1,066,835 |
| 2015 | $12,176 | $1,005,480 | $0 | $1,005,480 |
| 2014 | $11,824 | $939,930 | $0 | $939,930 |
Source: Public Records
Map
Nearby Homes
- 27 Bowdoin St Unit 1C
- 27 Bowdoin St Unit 5
- 27 Bowdoin St Unit 1B
- 13 Bowdoin St Unit 3AB
- 34 Temple St
- 34 Temple St Unit 34
- 40 Temple St
- 9 Bowdoin St
- 14 Temple St Unit 14
- 45 Temple St Unit 306
- 45 Temple St Unit 408
- 45 Temple St Unit 405
- 45 Temple St Unit 502
- 45 Temple St Unit 410
- 45 Temple St Unit 202
- 15 Hancock St Unit 1
- 9 Hancock St Unit 5
- 57 Hancock St
- 23 Joy St Unit 1
- 22 Joy St
- 31 Bowdoin St Unit 4
- 31 Bowdoin St Unit 3
- 31 Bowdoin St Unit 2
- 31 Bowdoin St Unit 1
- 31 Bowdoin St Unit 5
- 31 Bowdoin St Unit 31
- 31 Bowdoin St
- 33 Bowdoin St Unit 1
- 33 Bowdoin St
- 33 Bowdoin St Unit B
- 33 Bowdoin St Unit 3
- 33 Bowdoin St Unit PH
- 33-35 Bowdoin St Unit 2-2
- 33-35 Bowdoin St Unit 2-3
- 29 Bowdoin St Unit 5
- 29 Bowdoin St Unit 4
- 29 Bowdoin St Unit 3
- 29 Bowdoin St Unit 2
- 29 Bowdoin St Unit 1
- 1 Bowdoin St Unit 22