
Landlord's Agent in 2023
Steve Facelle
William Raveis R.E. & Home Services
(845) 641-1597
41 Total Sales
Estimated Value: $622,000 - $650,000
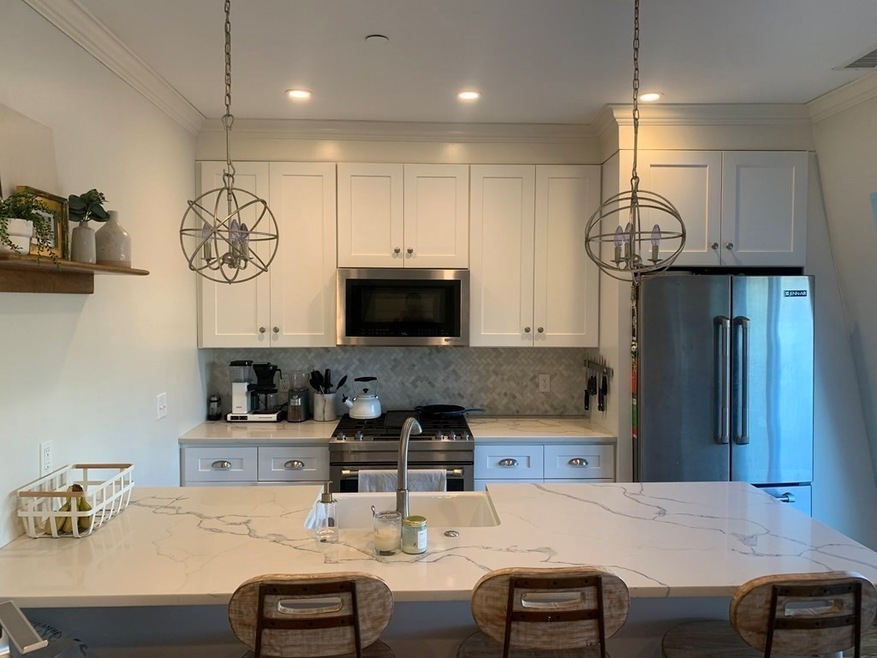
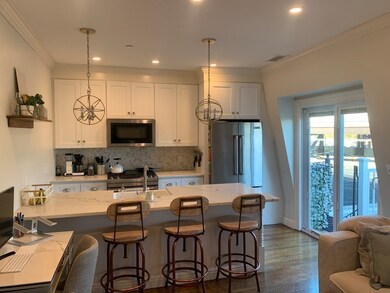
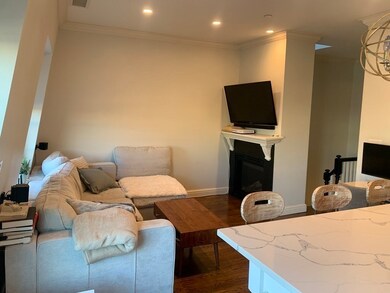
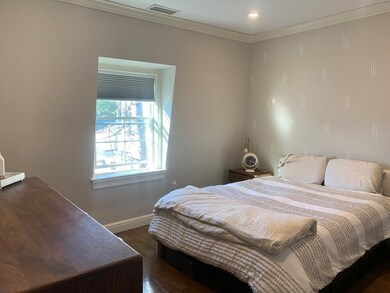
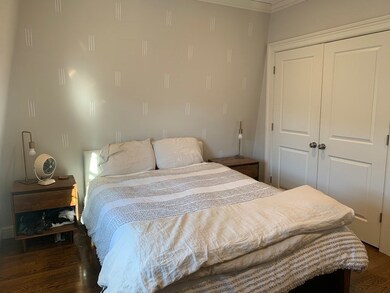
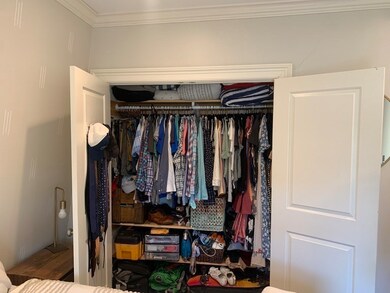
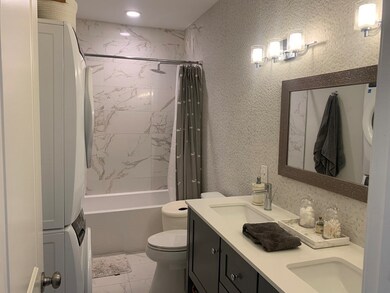
Gorgeous penthouse unit in Charlestown's Sullivan Square! Don't miss this luxurious 2 Bed, 1 Bath condo that was completely gut renovated in 2017 and meticulously maintained by the current owner occupants. Features include an open concept living room with Chef's kitchen, modern bathroom, gleaming hardwood floors, efficient storage, and tons of natural light. Second bedroom is perfect for a work from home office or guest room. Complete with Central AC, in-unit laundry, gas fireplace, and a sizable private deck, this charming condo has all of the comforts of home. Unbeatable location, just a few blocks to the Sullivan Square T Station, as well as countless restaurants and city conveniences.*Could be available sooner than 9/1 if needed.
Last Agent to Rent the Property
William Raveis R.E. & Home Services Listed on: 07/24/2023
| Date | Buyer | Sale Price | Title Company |
|---|---|---|---|
| Rock Peter | $464,000 | -- |
| Date | Status | Borrower | Loan Amount |
|---|---|---|---|
| Open | Rock Peter | $440,800 |
| Date | Event | Price | List to Sale | Price per Sq Ft | Prior Sale |
|---|---|---|---|---|---|
| 08/18/2023 08/18/23 | Rented | $2,900 | 0.0% | -- | |
| 08/17/2023 08/17/23 | Under Contract | -- | -- | -- | |
| 08/10/2023 08/10/23 | Price Changed | $2,900 | -3.3% | $5 / Sq Ft | |
| 07/24/2023 07/24/23 | For Rent | $3,000 | 0.0% | -- | |
| 11/07/2022 11/07/22 | Rented | $3,000 | 0.0% | -- | |
| 10/31/2022 10/31/22 | Price Changed | $3,000 | -3.2% | $5 / Sq Ft | |
| 10/24/2022 10/24/22 | For Rent | $3,100 | 0.0% | -- | |
| 10/30/2017 10/30/17 | Sold | $464,000 | +5.7% | $714 / Sq Ft | View Prior Sale |
| 06/29/2017 06/29/17 | Pending | -- | -- | -- | |
| 06/24/2017 06/24/17 | For Sale | $439,000 | -- | $675 / Sq Ft |
| Year | Tax Paid | Tax Assessment Tax Assessment Total Assessment is a certain percentage of the fair market value that is determined by local assessors to be the total taxable value of land and additions on the property. | Land | Improvement |
|---|---|---|---|---|
| 2025 | $6,850 | $591,500 | $0 | $591,500 |
| 2024 | $6,226 | $571,200 | $0 | $571,200 |
| 2023 | $5,951 | $554,100 | $0 | $554,100 |
| 2022 | $5,685 | $532,800 | $0 | $532,800 |
| 2021 | $5,685 | $532,800 | $0 | $532,800 |
| 2020 | $4,922 | $466,100 | $0 | $466,100 |
| 2019 | $4,387 | $416,200 | $0 | $416,200 |
Landlord's Agent in 2023
Steve Facelle
William Raveis R.E. & Home Services
(845) 641-1597
41 Total Sales
Tenant's Agent in 2023
Danny Allen
Coldwell Banker Realty - Boston
(516) 761-9354
32 Total Sales
Seller's Agent in 2017
Adam Geragosian
Compass
(617) 206-3333
26 in this area
132 Total Sales
Buyer's Agent in 2017
Ethan Goodrich
Compass
(617) 398-4444
1 in this area
37 Total Sales
Source: MLS Property Information Network (MLS PIN)
MLS Number: 73139994
APN: 0202026006
Disclaimer: Certain information contained herein is derived from information provided by parties other than Homes.com. All information provided is deemed reliable, but is not guaranteed to be accurate and should be independently verified.
![]() The property listing data and information, or the Images, set forth herein were provided to MLS Property Information Network, Inc. from third party sources, including sellers, lessors and public records, and were compiled by MLS Property Information Network, Inc. The property listing data and information, and the Images, are for the personal, non-commercial use of consumers having a good faith interest in purchasing or leasing listed properties of the type displayed to them and may not be used for any purpose other than to identify prospective properties which such consumers may have a good faith interest in purchasing or leasing. MLS Property Information Network, Inc. and its subscribers disclaim any and all representations and warranties as to the accuracy of the property listing data and information, or as to the accuracy of any of the Images, set forth herein.
The property listing data and information, or the Images, set forth herein were provided to MLS Property Information Network, Inc. from third party sources, including sellers, lessors and public records, and were compiled by MLS Property Information Network, Inc. The property listing data and information, and the Images, are for the personal, non-commercial use of consumers having a good faith interest in purchasing or leasing listed properties of the type displayed to them and may not be used for any purpose other than to identify prospective properties which such consumers may have a good faith interest in purchasing or leasing. MLS Property Information Network, Inc. and its subscribers disclaim any and all representations and warranties as to the accuracy of the property listing data and information, or as to the accuracy of any of the Images, set forth herein.