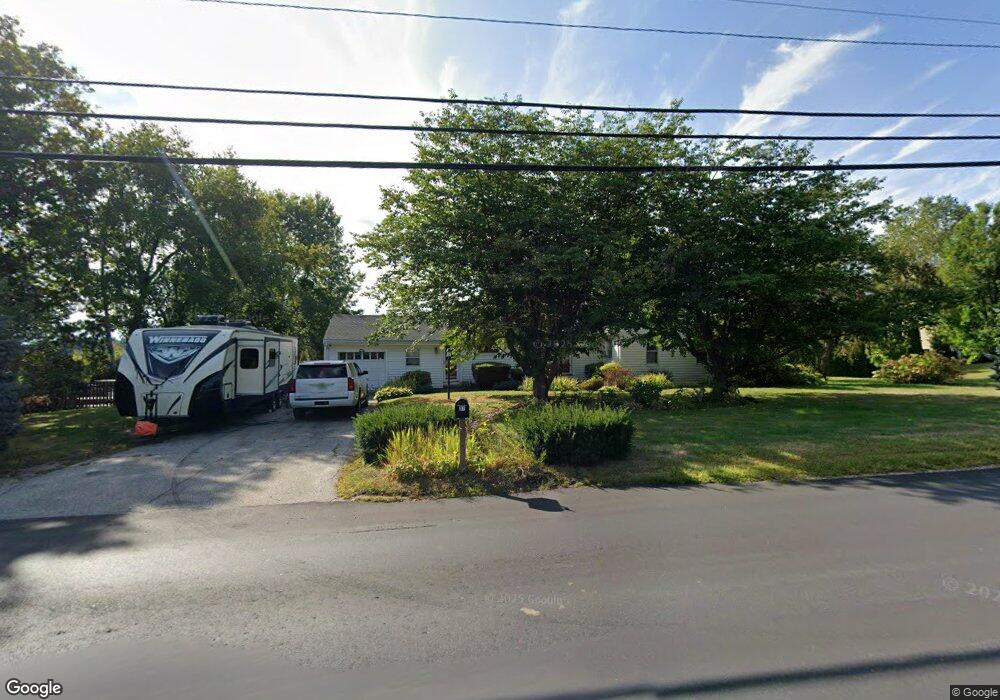
31 Broad St Hollis, NH 03049
Hollis NeighborhoodEstimated Value: $570,286 - $725,000
4
Beds
2
Baths
1,625
Sq Ft
$387/Sq Ft
Est. Value
About This Home
This home is located at 31 Broad St, Hollis, NH 03049 and is currently estimated at $628,572, approximately $386 per square foot. 31 Broad St is a home with nearby schools including Hollis Primary School, Hollis Upper Elementary School, and Hollis-Brookline Middle School.
Ownership History
Date
Name
Owned For
Owner Type
Purchase Details
Closed on
Jun 25, 2007
Sold by
Twichell Charles Michael
Bought by
Lingley John L and Lingley Kathleen E
Current Estimated Value
Home Financials for this Owner
Home Financials are based on the most recent Mortgage that was taken out on this home.
Original Mortgage
$159,000
Interest Rate
6.14%
Mortgage Type
Purchase Money Mortgage
Create a Home Valuation Report for This Property
The Home Valuation Report is an in-depth analysis detailing your home's value as well as a comparison with similar homes in the area
Home Values in the Area
Average Home Value in this Area
Purchase History
| Date | Buyer | Sale Price | Title Company |
|---|---|---|---|
| Lingley John L | $269,000 | -- |
Source: Public Records
Mortgage History
| Date | Status | Borrower | Loan Amount |
|---|---|---|---|
| Open | Lingley John L | $168,600 | |
| Closed | Lingley John L | $174,000 | |
| Closed | Lingley John L | $159,000 |
Source: Public Records
Tax History Compared to Growth
Tax History
| Year | Tax Paid | Tax Assessment Tax Assessment Total Assessment is a certain percentage of the fair market value that is determined by local assessors to be the total taxable value of land and additions on the property. | Land | Improvement |
|---|---|---|---|---|
| 2024 | $7,927 | $447,100 | $230,800 | $216,300 |
| 2023 | $7,449 | $447,100 | $230,800 | $216,300 |
| 2022 | $10,091 | $447,100 | $230,800 | $216,300 |
| 2021 | $6,206 | $273,400 | $147,800 | $125,600 |
| 2020 | $6,337 | $273,400 | $147,800 | $125,600 |
| 2019 | $6,316 | $273,400 | $147,800 | $125,600 |
| 2018 | $5,925 | $273,400 | $147,800 | $125,600 |
| 2017 | $4,764 | $205,800 | $112,000 | $93,800 |
| 2016 | $4,822 | $205,800 | $112,000 | $93,800 |
| 2015 | $4,738 | $205,800 | $112,000 | $93,800 |
| 2014 | $4,760 | $205,800 | $112,000 | $93,800 |
| 2013 | $4,696 | $205,800 | $112,000 | $93,800 |
Source: Public Records
Map
Nearby Homes