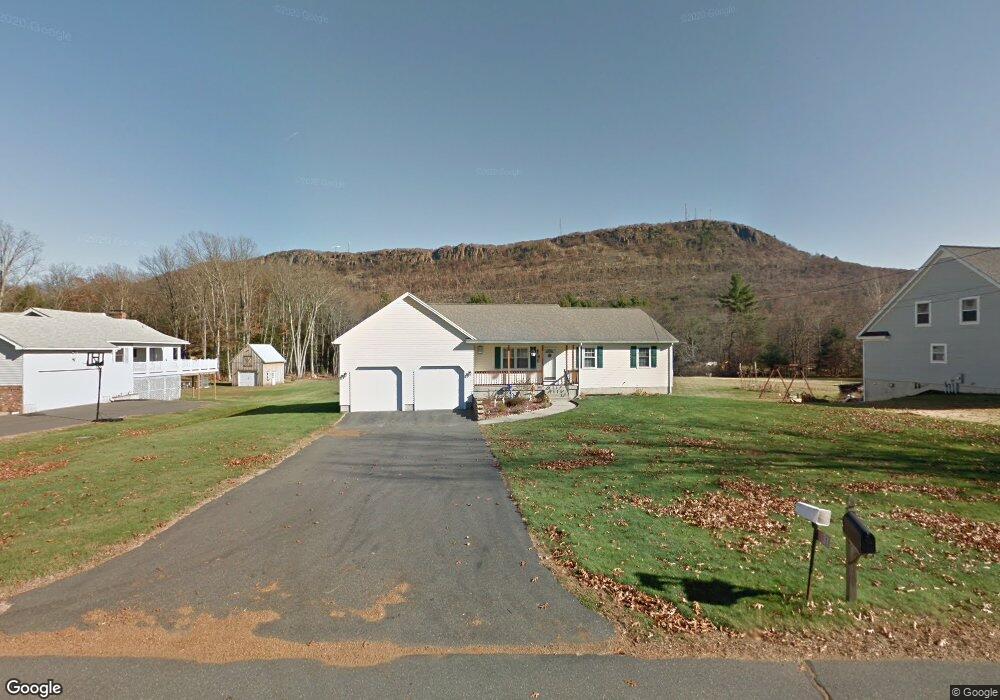
31 Brook St Easthampton, MA 01027
Estimated Value: $484,000 - $533,000
3
Beds
2
Baths
1,470
Sq Ft
$349/Sq Ft
Est. Value
About This Home
This home is located at 31 Brook St, Easthampton, MA 01027 and is currently estimated at $512,997, approximately $348 per square foot. 31 Brook St is a home located in Hampshire County with nearby schools including Easthampton High School, Tri-County Schools, and New England Adolescent Research Institute.
Ownership History
Date
Name
Owned For
Owner Type
Purchase Details
Closed on
Mar 16, 2012
Sold by
Nadeau Marilyn D
Bought by
Marilyn D Nadeau Irt
Current Estimated Value
Purchase Details
Closed on
Jun 25, 2002
Sold by
Hardy David A
Bought by
Nadeau Marilyn D and Nadeau Ronald H
Home Financials for this Owner
Home Financials are based on the most recent Mortgage that was taken out on this home.
Original Mortgage
$200,000
Interest Rate
6.81%
Mortgage Type
Purchase Money Mortgage
Create a Home Valuation Report for This Property
The Home Valuation Report is an in-depth analysis detailing your home's value as well as a comparison with similar homes in the area
Home Values in the Area
Average Home Value in this Area
Purchase History
| Date | Buyer | Sale Price | Title Company |
|---|---|---|---|
| Marilyn D Nadeau Irt | -- | -- | |
| Nadeau Marilyn D | $237,500 | -- |
Source: Public Records
Mortgage History
| Date | Status | Borrower | Loan Amount |
|---|---|---|---|
| Previous Owner | Nadeau Marilyn D | $200,000 | |
| Previous Owner | Nadeau Marilyn D | $190,000 |
Source: Public Records
Tax History
| Year | Tax Paid | Tax Assessment Tax Assessment Total Assessment is a certain percentage of the fair market value that is determined by local assessors to be the total taxable value of land and additions on the property. | Land | Improvement |
|---|---|---|---|---|
| 2025 | $6,832 | $499,800 | $134,700 | $365,100 |
| 2024 | $6,597 | $486,500 | $130,800 | $355,700 |
| 2023 | $4,940 | $337,200 | $103,700 | $233,500 |
| 2022 | $5,574 | $337,200 | $103,700 | $233,500 |
| 2021 | $6,120 | $348,900 | $103,700 | $245,200 |
| 2020 | $5,989 | $337,200 | $103,700 | $233,500 |
| 2019 | $4,981 | $322,200 | $103,700 | $218,500 |
| 2018 | $4,757 | $297,300 | $97,600 | $199,700 |
| 2017 | $4,644 | $286,500 | $93,800 | $192,700 |
| 2016 | $4,530 | $290,600 | $93,800 | $196,800 |
| 2015 | $4,403 | $290,600 | $93,800 | $196,800 |
Source: Public Records
Map
Nearby Homes
Your Personal Tour Guide
Ask me questions while you tour the home.