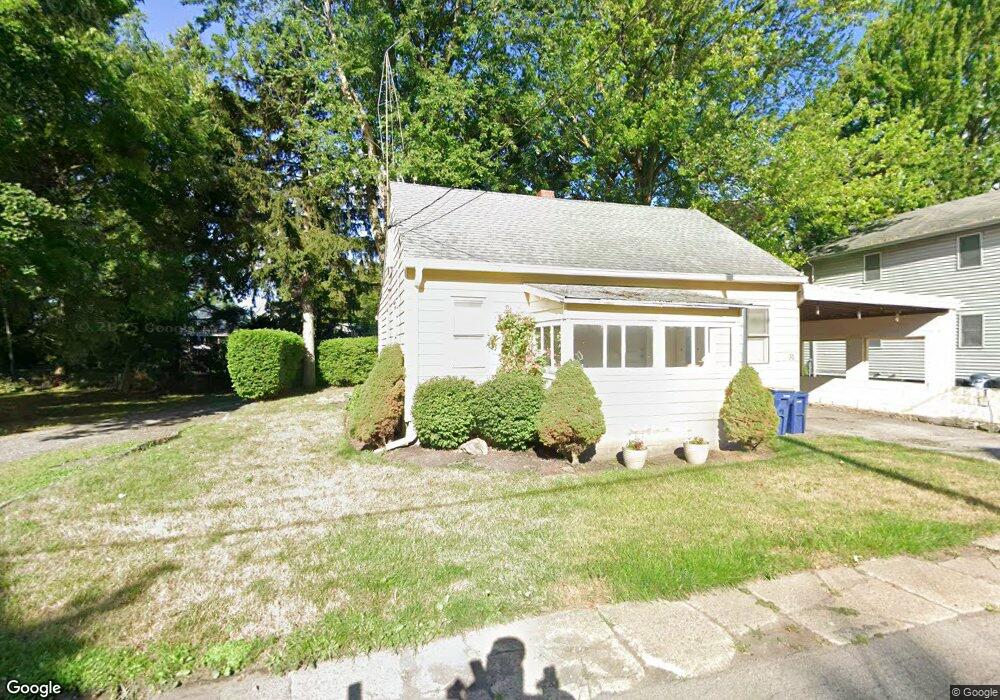
31 Carlton Place Lockport, NY 14094
Estimated Value: $132,000 - $164,000
2
Beds
1
Bath
1,290
Sq Ft
$114/Sq Ft
Est. Value
About This Home
This home is located at 31 Carlton Place, Lockport, NY 14094 and is currently estimated at $147,532, approximately $114 per square foot. 31 Carlton Place is a home located in Niagara County with nearby schools including Aaron Mossell Junior High School, Lockport High School, and DeSales Catholic School.
Ownership History
Date
Name
Owned For
Owner Type
Purchase Details
Closed on
Jan 30, 2012
Sold by
Equity Holding Corp Astru
Bought by
Garnes Benjamin
Current Estimated Value
Home Financials for this Owner
Home Financials are based on the most recent Mortgage that was taken out on this home.
Original Mortgage
$6,508
Interest Rate
3.96%
Mortgage Type
Stand Alone Second
Purchase Details
Closed on
Jan 14, 2012
Sold by
Equity Holding Corporation
Bought by
Garnes Benjamin A and Garner Rebecca J
Home Financials for this Owner
Home Financials are based on the most recent Mortgage that was taken out on this home.
Original Mortgage
$6,508
Interest Rate
3.96%
Mortgage Type
Stand Alone Second
Purchase Details
Closed on
Jul 14, 2009
Sold by
Zapp Anita
Bought by
Equity Holding Corp As Trustee
Purchase Details
Closed on
Nov 18, 2005
Sold by
Allwang Annette
Bought by
Zapp Anita
Create a Home Valuation Report for This Property
The Home Valuation Report is an in-depth analysis detailing your home's value as well as a comparison with similar homes in the area
Home Values in the Area
Average Home Value in this Area
Purchase History
| Date | Buyer | Sale Price | Title Company |
|---|---|---|---|
| Garnes Benjamin | $45,000 | Allen Miskell | |
| Garnes Benjamin A | $45,000 | None Available | |
| Equity Holding Corp As Trustee | -- | -- | |
| Equity Holding Corporation | -- | None Available | |
| Zapp Anita | $16,500 | Phillip Chamot |
Source: Public Records
Mortgage History
| Date | Status | Borrower | Loan Amount |
|---|---|---|---|
| Closed | Garnes Benjamin | $6,508 | |
| Open | Garnes Benjamin A | $57,812 |
Source: Public Records
Tax History Compared to Growth
Tax History
| Year | Tax Paid | Tax Assessment Tax Assessment Total Assessment is a certain percentage of the fair market value that is determined by local assessors to be the total taxable value of land and additions on the property. | Land | Improvement |
|---|---|---|---|---|
| 2024 | $2,017 | $92,000 | $4,000 | $88,000 |
| 2023 | $1,963 | $88,000 | $4,000 | $84,000 |
| 2022 | $1,361 | $80,000 | $4,000 | $76,000 |
| 2021 | $1,389 | $51,100 | $5,800 | $45,300 |
| 2020 | $1,274 | $51,100 | $5,800 | $45,300 |
| 2019 | $442 | $51,100 | $5,800 | $45,300 |
| 2018 | $709 | $51,100 | $5,800 | $45,300 |
| 2017 | $682 | $51,100 | $5,800 | $45,300 |
| 2016 | $610 | $51,100 | $5,800 | $45,300 |
| 2015 | -- | $51,100 | $5,800 | $45,300 |
| 2014 | -- | $51,100 | $5,800 | $45,300 |
Source: Public Records
Map
Nearby Homes