31 Carlton Rd Flanders, NJ 07836
Estimated Value: $871,000 - $994,000
--
Bed
--
Bath
3,393
Sq Ft
$276/Sq Ft
Est. Value
About This Home
This home is located at 31 Carlton Rd, Flanders, NJ 07836 and is currently estimated at $935,535, approximately $275 per square foot. 31 Carlton Rd is a home located in Morris County with nearby schools including Mt Olive Middle School, Mount Olive High School, and American Christian School.
Ownership History
Date
Name
Owned For
Owner Type
Purchase Details
Closed on
Jul 28, 2006
Sold by
Newman Hope Ann
Bought by
James Michael and James Kathleen
Current Estimated Value
Home Financials for this Owner
Home Financials are based on the most recent Mortgage that was taken out on this home.
Original Mortgage
$425,000
Outstanding Balance
$254,331
Interest Rate
6.7%
Mortgage Type
New Conventional
Estimated Equity
$681,204
Purchase Details
Closed on
Dec 4, 2003
Sold by
Newman Hope
Bought by
Newman Hope
Purchase Details
Closed on
Aug 22, 1994
Sold by
Bennington Hunt Lp
Bought by
Newman Richard and Newman Hope
Home Financials for this Owner
Home Financials are based on the most recent Mortgage that was taken out on this home.
Original Mortgage
$150,000
Interest Rate
8.65%
Create a Home Valuation Report for This Property
The Home Valuation Report is an in-depth analysis detailing your home's value as well as a comparison with similar homes in the area
Home Values in the Area
Average Home Value in this Area
Purchase History
| Date | Buyer | Sale Price | Title Company |
|---|---|---|---|
| James Michael | $700,000 | -- | |
| Newman Hope | -- | -- | |
| Newman Richard | $360,518 | -- |
Source: Public Records
Mortgage History
| Date | Status | Borrower | Loan Amount |
|---|---|---|---|
| Open | James Michael | $425,000 | |
| Previous Owner | Newman Richard | $150,000 |
Source: Public Records
Tax History Compared to Growth
Tax History
| Year | Tax Paid | Tax Assessment Tax Assessment Total Assessment is a certain percentage of the fair market value that is determined by local assessors to be the total taxable value of land and additions on the property. | Land | Improvement |
|---|---|---|---|---|
| 2025 | $17,596 | $504,900 | $177,100 | $327,800 |
| 2024 | $16,596 | $504,900 | $177,100 | $327,800 |
| 2023 | $16,596 | $504,900 | $177,100 | $327,800 |
| 2022 | $16,955 | $504,900 | $177,100 | $327,800 |
| 2021 | $16,955 | $504,900 | $177,100 | $327,800 |
| 2020 | $16,727 | $504,900 | $177,100 | $327,800 |
| 2019 | $16,672 | $504,900 | $177,100 | $327,800 |
| 2018 | $16,510 | $504,900 | $177,100 | $327,800 |
| 2017 | $16,222 | $504,900 | $177,100 | $327,800 |
| 2016 | $15,707 | $504,900 | $177,100 | $327,800 |
| 2015 | $16,076 | $504,900 | $177,100 | $327,800 |
| 2014 | $16,091 | $504,900 | $177,100 | $327,800 |
Source: Public Records
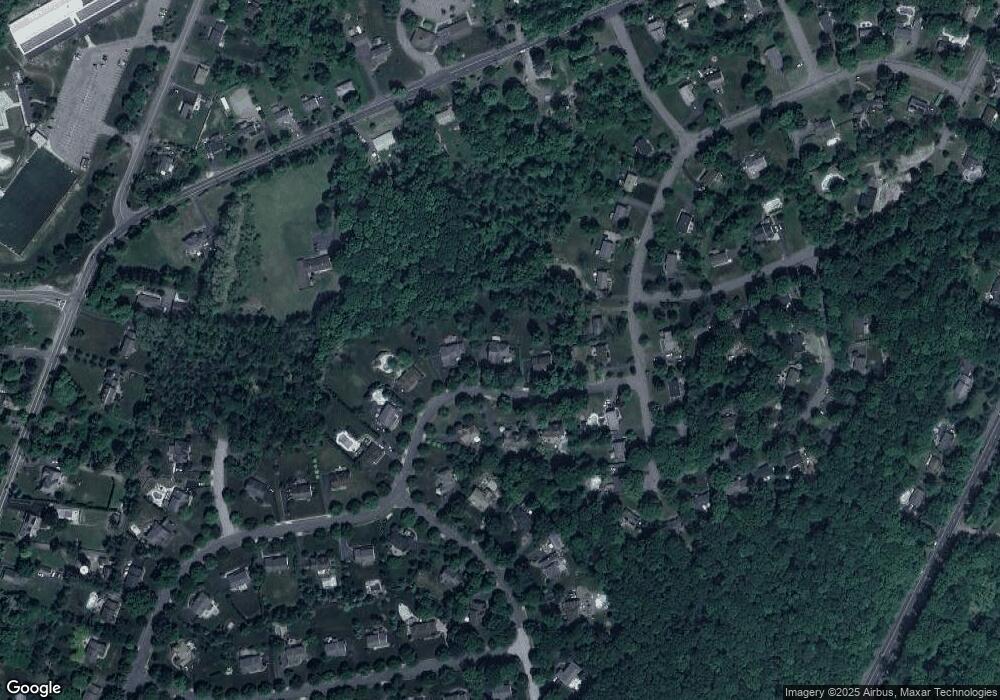
Map
Nearby Homes
- 1 Kenneth Terrace
- 146 U S Highway 206
- 5 Fennimore Ct
- 150 U S Highway 206
- 24 Ramar St
- 139 Flanders Netcong Rd
- 8 Stark Ct
- 6 Mountain Ave
- 11 Southwind Dr
- 17 Scarborough Ct
- 81 Clinton Ave
- 72 Flanders Drakestown Rd
- 6 Glenn Dr
- 23 Hillside Ave
- 19 Park Place
- 27 Jefferson Dr
- 32 Radcliffe Dr
- 38 Crestwood Cir
- 6 Perin Place
- 21 Mount Olive Rd