


31 Cedar St Bridgewater, MA 02324
5
Beds
3
Baths
2,800
Sq Ft
9,300
Sq Ft Lot
Highlights
- Golf Course Community
- Property is near public transit
- Tennis Courts
- Medical Services
- Wood Flooring
- Jogging Path
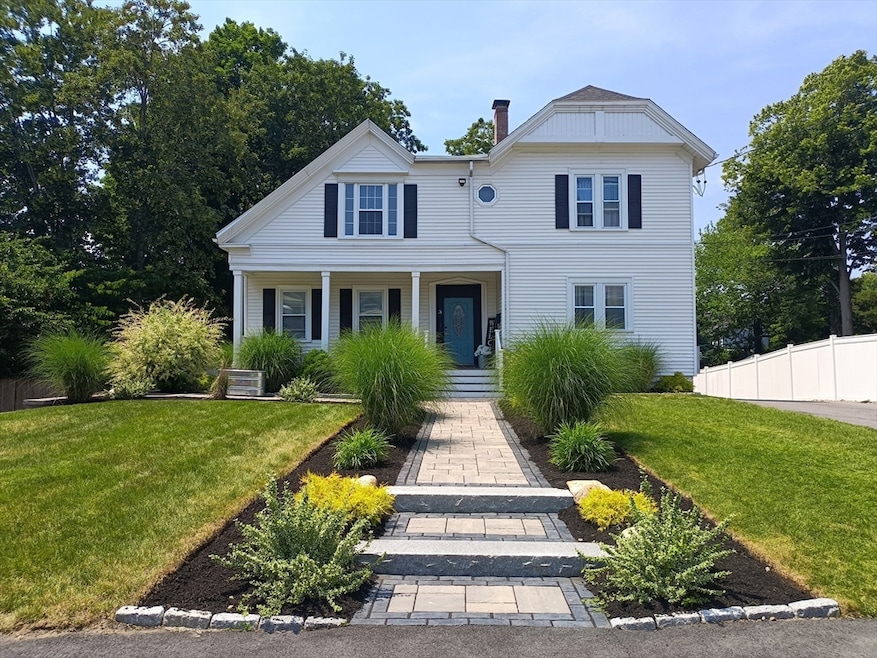
About This Home
As of October 2024BACK ON MARKET. BUYERS FINANCING FELL THROUGH. Welcome to Beautiful Bridgewater! This amazing 2 family will be sure to get your attention. Located across from Bridgewater State University, and conveniently close to the center of town, commuter rail, and local amenities. This property boasts pride of ownership and curb appeal! Gorgeous stone walkways with lush plants, and beautifully maintained landscaping greet you along with a great front porch perfect for your morning coffee or relaxing after a long day. The spacious first unit has two levels recently renovated with 4 large bedrooms, 2 full bathrooms, living, and dining room with hardwood flooring, and a laundry room. Stunning eat-in kitchen features plenty of natural light, white shaker cabinets, quartz countertops, a large island, new flooring, fixtures, and stainless steel appliances. Second unit is a studio apartment completely renovated. Property has two driveways, and plenty of off-street parking. Don't miss out on this Gem!
Property Details
Home Type
- Multi-Family
Est. Annual Taxes
- $6,780
Year Built
- Built in 1870
Home Design
- Duplex
- Shingle Roof
Interior Spaces
- 2,800 Sq Ft Home
- Property has 2 Levels
- Finished Basement
- Basement Fills Entire Space Under The House
Flooring
- Wood
- Tile
- Vinyl
Bedrooms and Bathrooms
- 5 Bedrooms
- 3 Full Bathrooms
Parking
- 8 Car Parking Spaces
- Driveway
- Paved Parking
- Open Parking
- Off-Street Parking
Location
- Property is near public transit
- Property is near schools
Additional Features
- Porch
- 9,300 Sq Ft Lot
Listing and Financial Details
- Total Actual Rent $1,700
- Tax Lot 169
- Assessor Parcel Number M:034 L:169,930489
Community Details
Amenities
- Medical Services
- Shops
- Coin Laundry
Recreation
- Golf Course Community
- Tennis Courts
- Park
- Jogging Path
- Bike Trail
Additional Features
- 2 Units
- Net Operating Income $20,400
Ownership History
Date
Name
Owned For
Owner Type
Purchase Details
Closed on
Jan 30, 2008
Sold by
Emc Mortgage Corp and Jp Morgan Chase Bk
Bought by
Pawlowski Alicia W
Total Days on Market
71
Current Estimated Value
Purchase Details
Closed on
Mar 6, 2007
Sold by
Reed Edward J
Bought by
Jp Morgan Chase Bank N
Purchase Details
Closed on
Sep 15, 2005
Sold by
Murata Yoshitaka
Bought by
Reed Edward J
Purchase Details
Closed on
Nov 19, 2002
Sold by
Willis Arthur N and Willis Kathy P
Bought by
Murata Yoshitaka
Map
Create a Home Valuation Report for This Property
The Home Valuation Report is an in-depth analysis detailing your home's value as well as a comparison with similar homes in the area
Similar Homes in Bridgewater, MA
Home Values in the Area
Average Home Value in this Area
Purchase History
| Date | Type | Sale Price | Title Company |
|---|---|---|---|
| Deed | $267,750 | -- | |
| Foreclosure Deed | $337,876 | -- | |
| Deed | $375,000 | -- | |
| Deed | $300,700 | -- | |
| Deed | $267,750 | -- | |
| Foreclosure Deed | $337,876 | -- | |
| Deed | $375,000 | -- | |
| Deed | $300,700 | -- |
Source: Public Records
Mortgage History
| Date | Status | Loan Amount | Loan Type |
|---|---|---|---|
| Open | $785,510 | Purchase Money Mortgage | |
| Closed | $785,510 | Purchase Money Mortgage | |
| Closed | $407,550 | New Conventional |
Source: Public Records
Property History
| Date | Event | Price | Change | Sq Ft Price |
|---|---|---|---|---|
| 10/17/2024 10/17/24 | Sold | $800,000 | +3.2% | $286 / Sq Ft |
| 09/04/2024 09/04/24 | Pending | -- | -- | -- |
| 08/30/2024 08/30/24 | For Sale | $774,900 | 0.0% | $277 / Sq Ft |
| 07/12/2024 07/12/24 | Pending | -- | -- | -- |
| 06/24/2024 06/24/24 | Price Changed | $774,900 | 0.0% | $277 / Sq Ft |
| 06/24/2024 06/24/24 | For Sale | $774,900 | -3.1% | $277 / Sq Ft |
| 06/24/2024 06/24/24 | Off Market | $800,000 | -- | -- |
| 06/24/2024 06/24/24 | For Sale | $759,900 | +78.8% | $271 / Sq Ft |
| 01/31/2018 01/31/18 | Sold | $425,000 | -0.9% | $125 / Sq Ft |
| 10/18/2017 10/18/17 | Pending | -- | -- | -- |
| 09/17/2017 09/17/17 | Price Changed | $429,000 | 0.0% | $126 / Sq Ft |
| 09/17/2017 09/17/17 | For Sale | $429,000 | +0.9% | $126 / Sq Ft |
| 09/13/2017 09/13/17 | Off Market | $425,000 | -- | -- |
| 06/25/2017 06/25/17 | Price Changed | $449,000 | -2.2% | $132 / Sq Ft |
| 06/15/2017 06/15/17 | Price Changed | $459,000 | -2.1% | $135 / Sq Ft |
| 05/26/2017 05/26/17 | For Sale | $469,000 | +10.4% | $138 / Sq Ft |
| 05/02/2017 05/02/17 | Off Market | $425,000 | -- | -- |
| 04/01/2017 04/01/17 | Price Changed | $469,000 | -2.1% | $138 / Sq Ft |
| 01/07/2017 01/07/17 | For Sale | $479,000 | -- | $141 / Sq Ft |
Source: MLS Property Information Network (MLS PIN)
Tax History
| Year | Tax Paid | Tax Assessment Tax Assessment Total Assessment is a certain percentage of the fair market value that is determined by local assessors to be the total taxable value of land and additions on the property. | Land | Improvement |
|---|---|---|---|---|
| 2025 | $7,314 | $618,300 | $190,700 | $427,600 |
| 2024 | $6,780 | $558,500 | $181,600 | $376,900 |
| 2023 | $6,708 | $522,400 | $169,700 | $352,700 |
| 2022 | $6,461 | $451,200 | $148,900 | $302,300 |
| 2021 | $6,038 | $416,000 | $132,900 | $283,100 |
| 2020 | $5,870 | $398,500 | $127,800 | $270,700 |
| 2019 | $5,734 | $375,800 | $127,800 | $248,000 |
| 2018 | $5,422 | $349,600 | $118,200 | $231,400 |
| 2017 | $5,097 | $325,200 | $118,200 | $207,000 |
| 2016 | $4,855 | $312,400 | $115,900 | $196,500 |
| 2015 | $4,843 | $298,200 | $112,500 | $185,700 |
| 2014 | $4,708 | $289,700 | $109,200 | $180,500 |
Source: Public Records
Source: MLS Property Information Network (MLS PIN)
MLS Number: 73256003
APN: BRID-000034-000000-000169
Disclaimer: Certain information contained herein is derived from information provided by parties other than Homes.com. All information provided is deemed reliable, but is not guaranteed to be accurate and should be independently verified.
![]() The property listing data and information, or the Images, set forth herein were provided to MLS Property Information Network, Inc. from third party sources, including sellers, lessors and public records, and were compiled by MLS Property Information Network, Inc. The property listing data and information, and the Images, are for the personal, non-commercial use of consumers having a good faith interest in purchasing or leasing listed properties of the type displayed to them and may not be used for any purpose other than to identify prospective properties which such consumers may have a good faith interest in purchasing or leasing. MLS Property Information Network, Inc. and its subscribers disclaim any and all representations and warranties as to the accuracy of the property listing data and information, or as to the accuracy of any of the Images, set forth herein.
The property listing data and information, or the Images, set forth herein were provided to MLS Property Information Network, Inc. from third party sources, including sellers, lessors and public records, and were compiled by MLS Property Information Network, Inc. The property listing data and information, and the Images, are for the personal, non-commercial use of consumers having a good faith interest in purchasing or leasing listed properties of the type displayed to them and may not be used for any purpose other than to identify prospective properties which such consumers may have a good faith interest in purchasing or leasing. MLS Property Information Network, Inc. and its subscribers disclaim any and all representations and warranties as to the accuracy of the property listing data and information, or as to the accuracy of any of the Images, set forth herein.
Nearby Homes