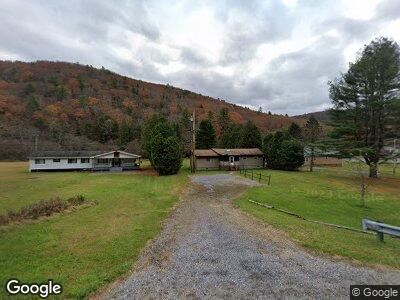
31 Chestnut St Cross Fork, PA 17729
Estimated Value: $142,000 - $247,000
3
Beds
1
Bath
1,378
Sq Ft
$159/Sq Ft
Est. Value
About This Home
This home is located at 31 Chestnut St, Cross Fork, PA 17729 and is currently estimated at $218,803, approximately $158 per square foot. 31 Chestnut St is a home located in Potter County.
Ownership History
Date
Name
Owned For
Owner Type
Purchase Details
Closed on
Nov 5, 2015
Sold by
Wiethorn Michael C and Wiethorn Linda J
Bought by
Kohler Kevin E and Kohler Cynthia L
Current Estimated Value
Home Financials for this Owner
Home Financials are based on the most recent Mortgage that was taken out on this home.
Original Mortgage
$111,920
Outstanding Balance
$89,464
Interest Rate
3.87%
Mortgage Type
New Conventional
Estimated Equity
$129,339
Purchase Details
Closed on
Nov 22, 2006
Sold by
Gipe Genevieve
Bought by
Wiethorn Michael G
Home Financials for this Owner
Home Financials are based on the most recent Mortgage that was taken out on this home.
Original Mortgage
$65,000
Interest Rate
6.39%
Mortgage Type
New Conventional
Purchase Details
Closed on
Nov 1, 2006
Sold by
Gipe Genveieve
Bought by
Wiethorn Michael G and Wiethorn Linda J
Home Financials for this Owner
Home Financials are based on the most recent Mortgage that was taken out on this home.
Original Mortgage
$65,000
Interest Rate
6.39%
Mortgage Type
New Conventional
Create a Home Valuation Report for This Property
The Home Valuation Report is an in-depth analysis detailing your home's value as well as a comparison with similar homes in the area
Home Values in the Area
Average Home Value in this Area
Purchase History
| Date | Buyer | Sale Price | Title Company |
|---|---|---|---|
| Kohler Kevin E | $139,900 | None Available | |
| Wiethorn Michael G | -- | None Available | |
| Wiethorn Michael G | $1,800 | None Available |
Source: Public Records
Mortgage History
| Date | Status | Borrower | Loan Amount |
|---|---|---|---|
| Open | Kohler Kevin E | $111,920 | |
| Previous Owner | Wiwthorn Michael G | $62,000 | |
| Previous Owner | Wiethorn Michael G | $65,000 | |
| Previous Owner | Wiethorn Michael G | $65,000 |
Source: Public Records
Tax History Compared to Growth
Tax History
| Year | Tax Paid | Tax Assessment Tax Assessment Total Assessment is a certain percentage of the fair market value that is determined by local assessors to be the total taxable value of land and additions on the property. | Land | Improvement |
|---|---|---|---|---|
| 2025 | $1,953 | $23,680 | $2,520 | $21,160 |
| 2024 | $1,773 | $23,680 | $2,520 | $21,160 |
| 2023 | $1,676 | $23,680 | $2,520 | $21,160 |
| 2022 | $1,582 | $23,680 | $2,520 | $21,160 |
| 2021 | $1,582 | $23,680 | $2,520 | $21,160 |
| 2020 | $1,519 | $23,680 | $2,520 | $21,160 |
| 2019 | $1,515 | $23,680 | $2,520 | $21,160 |
| 2018 | $1,441 | $23,680 | $2,520 | $21,160 |
| 2017 | -- | $23,680 | $2,520 | $21,160 |
| 2016 | $1,352 | $23,680 | $2,520 | $21,160 |
| 2015 | -- | $23,680 | $2,520 | $21,160 |
| 2012 | -- | $23,680 | $2,520 | $21,160 |
Source: Public Records
Map
Nearby Homes
- 0 Baileys Ln Unit WB-101097
- 146 Johns Ln
- 1992 Beaver Dam Rd
- 92 Lick Hollow Rd
- 691 Elk Lick Rd
- 15 Yamaha Ln
- 477 Bucky Rd
- 55 Main St
- 75 Summerson Mountain Rd
- LOT 2 Erie Ave
- 300 Erie Ave
- LOT 4 Saint Clair Ave
- 153 Zoerb Hollow Rd
- 232 4th St
- 0 Zoerb Hollow Rd
- 12614 Renovo Rd
- 191 Zoerb Hollow Rd
- 352 Susquehanna Ave
- 419 4th St
- 152 Susquehanna Ave