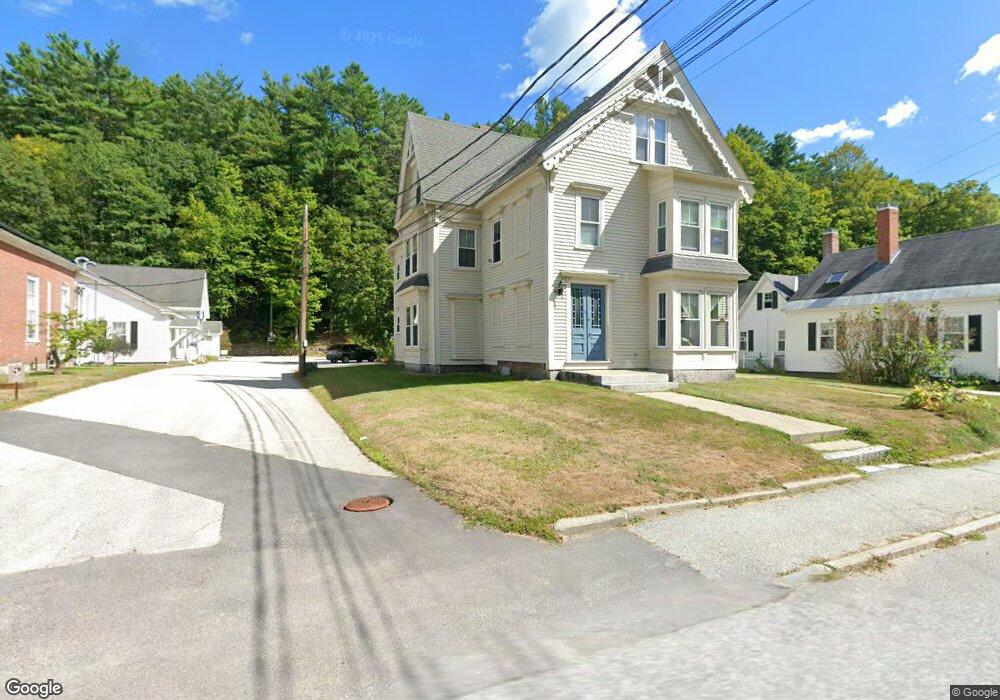
31 Concord St Peterborough, NH 03458
Estimated Value: $295,000 - $410,000
6
Beds
3
Baths
3,741
Sq Ft
$90/Sq Ft
Est. Value
About This Home
This home is located at 31 Concord St, Peterborough, NH 03458 and is currently estimated at $336,043, approximately $89 per square foot. 31 Concord St is a home with nearby schools including Peterborough Elementary School, South Meadow School, and Conval Regional High School.
Ownership History
Date
Name
Owned For
Owner Type
Purchase Details
Closed on
Jun 19, 2024
Sold by
Union Cong Chrch Peterbor
Bought by
Contoocook Housing T
Current Estimated Value
Home Financials for this Owner
Home Financials are based on the most recent Mortgage that was taken out on this home.
Original Mortgage
$100,000
Outstanding Balance
$98,564
Interest Rate
7.09%
Mortgage Type
Purchase Money Mortgage
Estimated Equity
$237,479
Create a Home Valuation Report for This Property
The Home Valuation Report is an in-depth analysis detailing your home's value as well as a comparison with similar homes in the area
Home Values in the Area
Average Home Value in this Area
Purchase History
| Date | Buyer | Sale Price | Title Company |
|---|---|---|---|
| Contoocook Housing T | $300,000 | None Available | |
| Contoocook Housing T | $300,000 | None Available | |
| Contoocook Housing T | $300,000 | None Available |
Source: Public Records
Mortgage History
| Date | Status | Borrower | Loan Amount |
|---|---|---|---|
| Open | Contoocook Housing T | $100,000 | |
| Closed | Contoocook Housing T | $100,000 |
Source: Public Records
Tax History Compared to Growth
Tax History
| Year | Tax Paid | Tax Assessment Tax Assessment Total Assessment is a certain percentage of the fair market value that is determined by local assessors to be the total taxable value of land and additions on the property. | Land | Improvement |
|---|---|---|---|---|
| 2024 | $9,315 | $286,600 | $67,200 | $219,400 |
| 2023 | -- | $288,300 | $68,900 | $219,400 |
| 2022 | $0 | $288,300 | $68,900 | $219,400 |
| 2021 | $0 | $288,300 | $68,900 | $219,400 |
| 2020 | $0 | $220,200 | $42,100 | $178,100 |
| 2019 | $0 | $220,200 | $42,100 | $178,100 |
| 2018 | $0 | $220,200 | $42,100 | $178,100 |
| 2017 | $0 | $188,500 | $30,200 | $158,300 |
| 2016 | -- | $188,500 | $30,200 | $158,300 |
| 2015 | -- | $188,500 | $30,200 | $158,300 |
| 2014 | -- | $174,900 | $23,500 | $151,400 |
Source: Public Records
Map
Nearby Homes