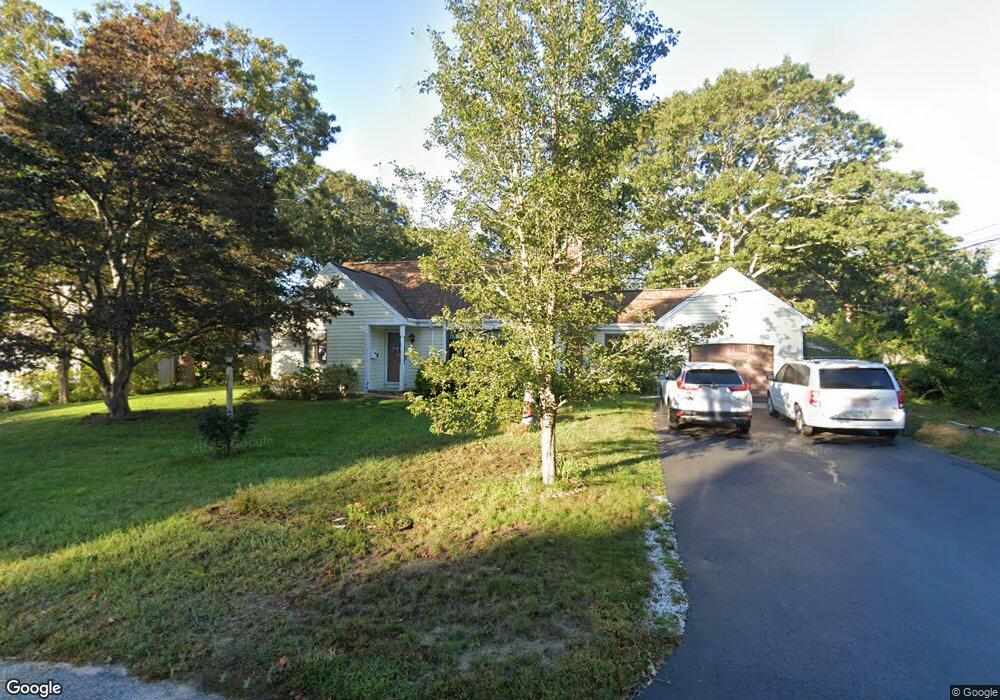
31 Davis Rd South Yarmouth, MA 02664
Estimated Value: $500,000 - $653,000
4
Beds
2
Baths
1,416
Sq Ft
$419/Sq Ft
Est. Value
About This Home
This home is located at 31 Davis Rd, South Yarmouth, MA 02664 and is currently estimated at $592,646, approximately $418 per square foot. 31 Davis Rd is a home located in Barnstable County with nearby schools including Dennis-Yarmouth Regional High School and St. Pius X. School.
Ownership History
Date
Name
Owned For
Owner Type
Purchase Details
Closed on
Mar 8, 2022
Sold by
Duncan Sandra J and Duncan John L
Bought by
Duncan Heritage T
Current Estimated Value
Purchase Details
Closed on
Mar 5, 2009
Sold by
Duncan Sandra J
Bought by
Duncan John L and Duncan Sandra J
Create a Home Valuation Report for This Property
The Home Valuation Report is an in-depth analysis detailing your home's value as well as a comparison with similar homes in the area
Home Values in the Area
Average Home Value in this Area
Purchase History
| Date | Buyer | Sale Price | Title Company |
|---|---|---|---|
| Duncan Heritage T | -- | None Available | |
| Duncan John L | -- | -- |
Source: Public Records
Tax History Compared to Growth
Tax History
| Year | Tax Paid | Tax Assessment Tax Assessment Total Assessment is a certain percentage of the fair market value that is determined by local assessors to be the total taxable value of land and additions on the property. | Land | Improvement |
|---|---|---|---|---|
| 2025 | $3,784 | $534,400 | $165,700 | $368,700 |
| 2024 | $3,503 | $474,700 | $144,100 | $330,600 |
| 2023 | $3,505 | $432,200 | $131,000 | $301,200 |
| 2022 | $3,230 | $351,900 | $125,000 | $226,900 |
| 2021 | $3,180 | $332,600 | $125,000 | $207,600 |
| 2020 | $3,147 | $314,700 | $132,300 | $182,400 |
| 2019 | $2,953 | $292,400 | $132,300 | $160,100 |
| 2018 | $2,781 | $270,300 | $110,200 | $160,100 |
| 2017 | $2,708 | $270,300 | $110,200 | $160,100 |
| 2016 | $2,610 | $261,500 | $101,400 | $160,100 |
| 2015 | $2,464 | $245,400 | $97,000 | $148,400 |
Source: Public Records
Map
Nearby Homes