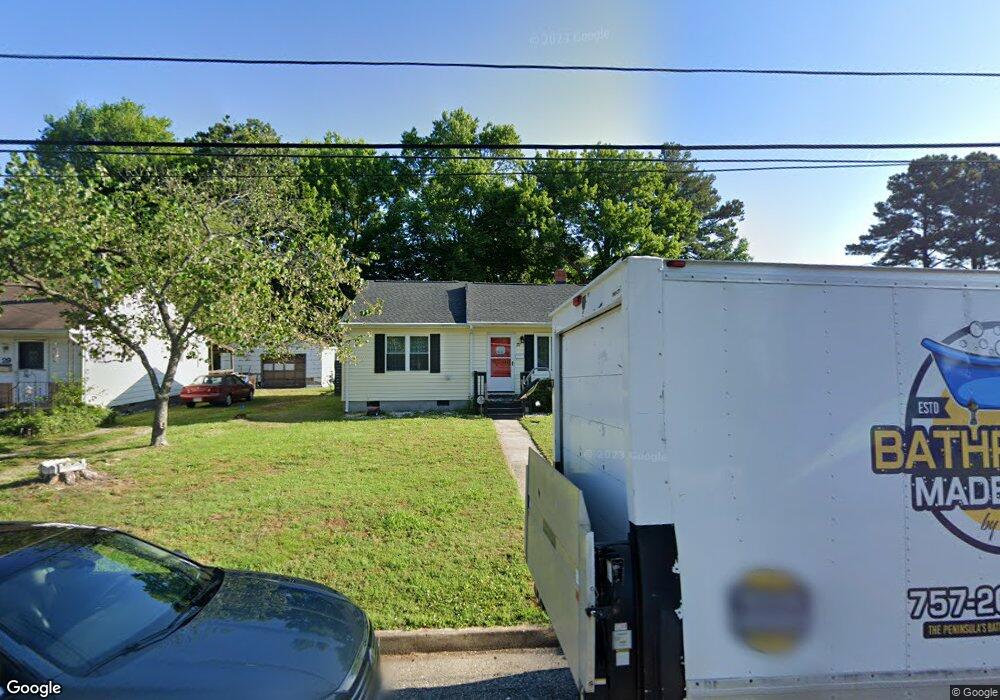
31 Dwight Rd Newport News, VA 23601
Morrison NeighborhoodEstimated Value: $234,000 - $290,000
2
Beds
1
Bath
721
Sq Ft
$363/Sq Ft
Est. Value
About This Home
This home is located at 31 Dwight Rd, Newport News, VA 23601 and is currently estimated at $261,743, approximately $363 per square foot. 31 Dwight Rd is a home located in Newport News City with nearby schools including Riverside Elementary School, Homer L. Hines Middle School, and Warwick High School.
Ownership History
Date
Name
Owned For
Owner Type
Purchase Details
Closed on
Apr 15, 2011
Sold by
Fannie Mae
Bought by
Everman Johnathan C
Current Estimated Value
Home Financials for this Owner
Home Financials are based on the most recent Mortgage that was taken out on this home.
Original Mortgage
$72,124
Outstanding Balance
$49,991
Interest Rate
4.9%
Mortgage Type
FHA
Estimated Equity
$211,752
Purchase Details
Closed on
Feb 8, 2011
Sold by
Muncy Trustee Johnie R and Willard Scott A
Bought by
Federal National Mortgage Association
Purchase Details
Closed on
May 23, 2007
Sold by
Fisher Douglas T
Bought by
Williard Scott A
Home Financials for this Owner
Home Financials are based on the most recent Mortgage that was taken out on this home.
Original Mortgage
$117,000
Interest Rate
6.27%
Mortgage Type
New Conventional
Create a Home Valuation Report for This Property
The Home Valuation Report is an in-depth analysis detailing your home's value as well as a comparison with similar homes in the area
Home Values in the Area
Average Home Value in this Area
Purchase History
| Date | Buyer | Sale Price | Title Company |
|---|---|---|---|
| Everman Johnathan C | $74,000 | -- | |
| Federal National Mortgage Association | $123,748 | -- | |
| Williard Scott A | $130,000 | -- |
Source: Public Records
Mortgage History
| Date | Status | Borrower | Loan Amount |
|---|---|---|---|
| Open | Everman Johnathan C | $72,124 | |
| Previous Owner | Williard Scott A | $117,000 |
Source: Public Records
Tax History Compared to Growth
Tax History
| Year | Tax Paid | Tax Assessment Tax Assessment Total Assessment is a certain percentage of the fair market value that is determined by local assessors to be the total taxable value of land and additions on the property. | Land | Improvement |
|---|---|---|---|---|
| 2024 | $2,745 | $232,600 | $60,500 | $172,100 |
| 2023 | $2,795 | $224,400 | $60,500 | $163,900 |
| 2022 | $2,619 | $206,000 | $60,500 | $145,500 |
| 2021 | $2,259 | $173,100 | $55,000 | $118,100 |
| 2020 | $2,126 | $162,200 | $55,000 | $107,200 |
| 2019 | $2,036 | $155,200 | $55,000 | $100,200 |
| 2018 | $1,952 | $148,600 | $55,000 | $93,600 |
| 2017 | $1,481 | $110,000 | $55,000 | $55,000 |
| 2016 | $1,477 | $110,000 | $55,000 | $55,000 |
| 2015 | $1,471 | $110,000 | $55,000 | $55,000 |
| 2014 | $1,280 | $113,500 | $55,000 | $58,500 |
Source: Public Records
Map
Nearby Homes