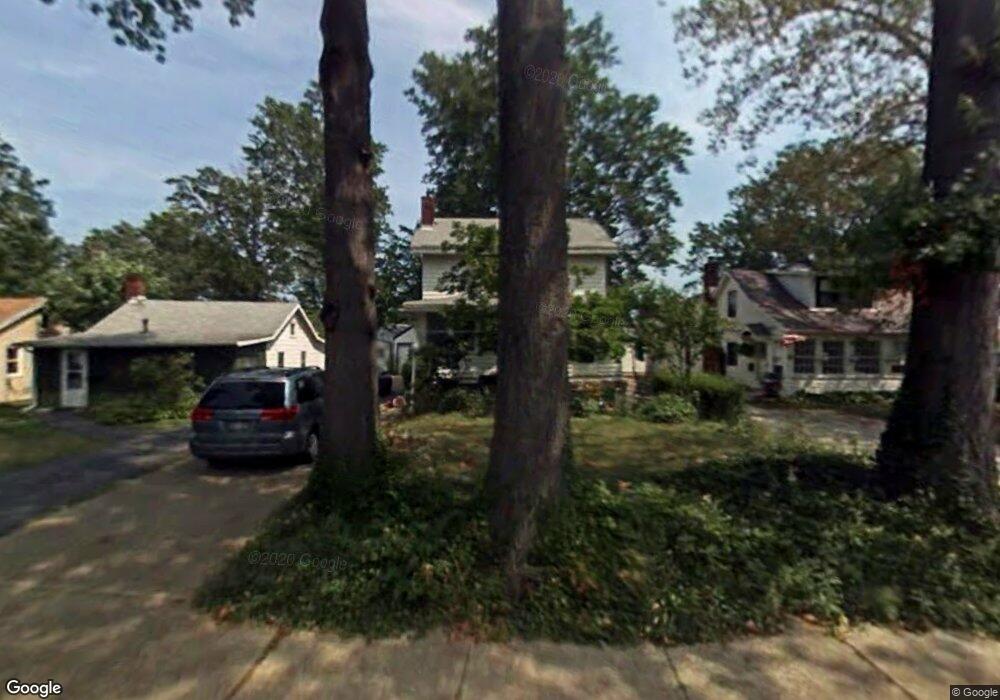
31 E 220th St Euclid, OH 44123
Estimated Value: $137,916 - $178,000
4
Beds
1
Bath
1,672
Sq Ft
$99/Sq Ft
Est. Value
About This Home
This home is located at 31 E 220th St, Euclid, OH 44123 and is currently estimated at $165,979, approximately $99 per square foot. 31 E 220th St is a home located in Cuyahoga County with nearby schools including Bluestone Elementary School, Euclid High School, and Pinnacle Academy.
Ownership History
Date
Name
Owned For
Owner Type
Purchase Details
Closed on
May 8, 2019
Sold by
Haverlock Lance M
Bought by
Your Home Llc
Current Estimated Value
Purchase Details
Closed on
Feb 3, 2011
Sold by
Haverlock Lance M and Haverlock Heidi A
Bought by
Your Homes Llc
Purchase Details
Closed on
Mar 27, 2006
Sold by
Haverlock Lance M and Haverlock Heidi A
Bought by
Haverlock Lance M and Haverlock Heidi A
Purchase Details
Closed on
Oct 30, 2002
Sold by
Haverlock V William
Bought by
Haverlock Lance M
Home Financials for this Owner
Home Financials are based on the most recent Mortgage that was taken out on this home.
Original Mortgage
$96,000
Interest Rate
6.18%
Purchase Details
Closed on
Jan 1, 1975
Bought by
Haverlock Vasyli W and Haverlock Mary J
Create a Home Valuation Report for This Property
The Home Valuation Report is an in-depth analysis detailing your home's value as well as a comparison with similar homes in the area
Home Values in the Area
Average Home Value in this Area
Purchase History
| Date | Buyer | Sale Price | Title Company |
|---|---|---|---|
| Your Home Llc | -- | Chicago Title Insurance Co | |
| Your Homes Llc | -- | Public | |
| Haverlock Lance M | -- | None Available | |
| Haverlock Lance M | $120,000 | Asta | |
| Haverlock Vasyli W | -- | -- |
Source: Public Records
Mortgage History
| Date | Status | Borrower | Loan Amount |
|---|---|---|---|
| Previous Owner | Haverlock Lance M | $96,000 |
Source: Public Records
Tax History
| Year | Tax Paid | Tax Assessment Tax Assessment Total Assessment is a certain percentage of the fair market value that is determined by local assessors to be the total taxable value of land and additions on the property. | Land | Improvement |
|---|---|---|---|---|
| 2025 | $3,224 | $47,530 | $9,835 | $37,695 |
| 2024 | $3,328 | $47,530 | $9,835 | $37,695 |
| 2023 | $2,997 | $34,060 | $5,500 | $28,560 |
| 2022 | $2,930 | $34,060 | $5,500 | $28,560 |
| 2021 | $3,271 | $34,060 | $5,500 | $28,560 |
| 2020 | $3,320 | $31,540 | $5,080 | $26,460 |
| 2019 | $2,993 | $90,100 | $14,500 | $75,600 |
| 2018 | $3,024 | $31,540 | $5,080 | $26,460 |
| 2017 | $3,321 | $28,980 | $4,970 | $24,010 |
| 2016 | $3,329 | $28,980 | $4,970 | $24,010 |
| 2015 | $3,034 | $28,980 | $4,970 | $24,010 |
| 2014 | $3,034 | $28,980 | $4,970 | $24,010 |
Source: Public Records
Map
Nearby Homes
- 94 E 217th St
- 170 E 220th St
- 55 Sunnycliff Dr
- 226 E 216th St
- 336 E 222nd St
- 285 E 216th St
- 461 Kenwood Dr Unit T3
- 324 E 235th St
- 450 Kenwood Dr Unit D-12
- 144 E 208th St
- 324 E 215th St
- 421 Kenwood Dr Unit G
- 323 E 235th St
- 23298 Williams Ave
- 71 Lake Edge Dr
- 22751 Fox Ave
- 521 Kenwood Dr Unit B-5
- 422 Clearview Dr Unit J10
- 328 E 238th St
- 271 E 238th St
Your Personal Tour Guide
Ask me questions while you tour the home.