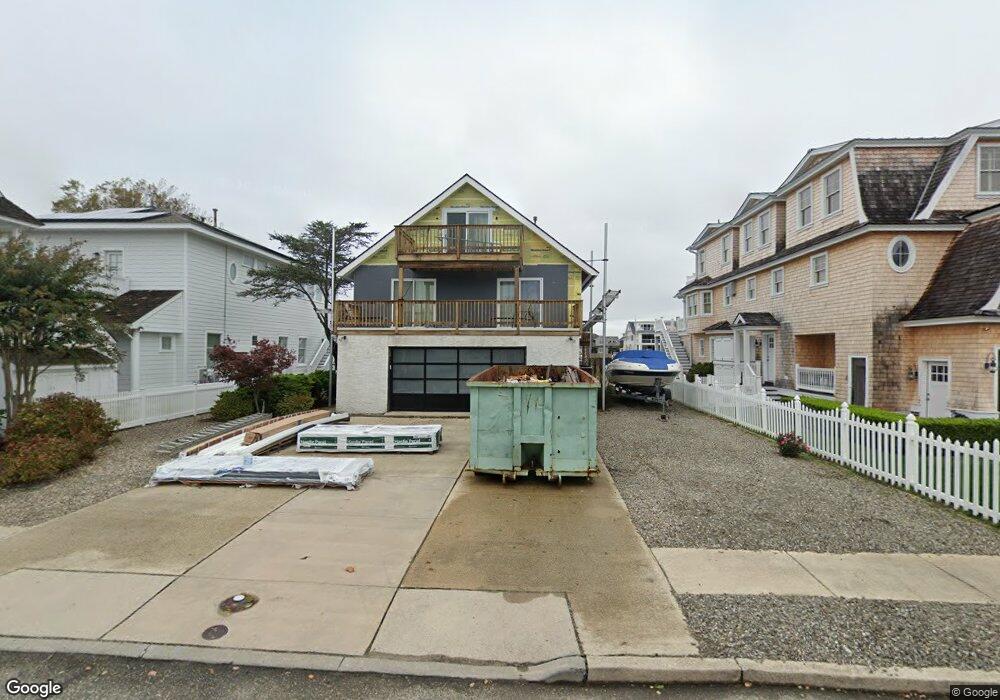
31 Flamingo Dr Avalon, NJ 08202
Estimated Value: $3,941,000 - $4,585,000
--
Bed
--
Bath
1,680
Sq Ft
$2,569/Sq Ft
Est. Value
About This Home
This home is located at 31 Flamingo Dr, Avalon, NJ 08202 and is currently estimated at $4,315,391, approximately $2,568 per square foot. 31 Flamingo Dr is a home located in Cape May County with nearby schools including Avalon Elementary School.
Ownership History
Date
Name
Owned For
Owner Type
Purchase Details
Closed on
Mar 5, 2020
Sold by
Kazanjian Stephen and Kaanjian James
Bought by
Kazanjian James
Current Estimated Value
Home Financials for this Owner
Home Financials are based on the most recent Mortgage that was taken out on this home.
Original Mortgage
$1,300,000
Outstanding Balance
$1,149,140
Interest Rate
3.4%
Mortgage Type
New Conventional
Estimated Equity
$3,166,251
Purchase Details
Closed on
Jun 18, 2013
Sold by
Kazanjian Arik
Bought by
Kazanjian James and Kazanjian Stephen
Purchase Details
Closed on
Sep 9, 2008
Sold by
Kazanjian Arik and Kazanjian Gloria
Bought by
Kazanjian Arik and Kazanjian Gloria
Purchase Details
Closed on
Aug 4, 1992
Sold by
New Jersey Dep
Bought by
Kazanjian Arik and Kazanjian Gloria
Create a Home Valuation Report for This Property
The Home Valuation Report is an in-depth analysis detailing your home's value as well as a comparison with similar homes in the area
Home Values in the Area
Average Home Value in this Area
Purchase History
| Date | Buyer | Sale Price | Title Company |
|---|---|---|---|
| Kazanjian James | -- | None Available | |
| Kazanjian James | -- | None Available | |
| Kazanjian Arik | -- | None Available | |
| Kazanjian Arik | $27,900 | -- |
Source: Public Records
Mortgage History
| Date | Status | Borrower | Loan Amount |
|---|---|---|---|
| Open | Kazanjian James | $1,300,000 |
Source: Public Records
Tax History Compared to Growth
Tax History
| Year | Tax Paid | Tax Assessment Tax Assessment Total Assessment is a certain percentage of the fair market value that is determined by local assessors to be the total taxable value of land and additions on the property. | Land | Improvement |
|---|---|---|---|---|
| 2025 | $15,005 | $2,443,800 | $2,400,000 | $43,800 |
| 2024 | $15,005 | $2,443,800 | $2,400,000 | $43,800 |
| 2023 | $14,883 | $2,443,800 | $2,400,000 | $43,800 |
| 2022 | $13,881 | $2,443,800 | $2,400,000 | $43,800 |
| 2021 | $13,368 | $2,443,800 | $2,400,000 | $43,800 |
| 2020 | $12,854 | $2,443,800 | $2,400,000 | $43,800 |
| 2019 | $12,463 | $2,443,800 | $2,400,000 | $43,800 |
| 2018 | $11,926 | $2,443,800 | $2,400,000 | $43,800 |
| 2017 | $9,586 | $1,724,100 | $1,650,000 | $74,100 |
| 2016 | $9,483 | $1,724,100 | $1,650,000 | $74,100 |
| 2015 | $9,327 | $1,724,100 | $1,650,000 | $74,100 |
| 2014 | $9,224 | $1,724,100 | $1,650,000 | $74,100 |
Source: Public Records
Map
Nearby Homes
- 35 Flamingo Dr
- 27 Flamingo Dr
- 39 Flamingo Dr
- 25 Flamingo Dr
- 38 Flamingo Dr
- 43 Flamingo Dr
- 34 Flamingo Dr
- 42 Flamingo Dr
- 30 Flamingo Dr
- 46 Flamingo Dr
- 15 Flamingo Dr
- 26 Flamingo Dr
- 50 Flamingo Dr
- 11 Flamingo Dr
- 47 Flamingo Dr
- 22 Flamingo Dr
- 54 Flamingo Dr
- 7 Flamingo Dr
- 47 Pelican Dr S
- 51 Pelican Dr S