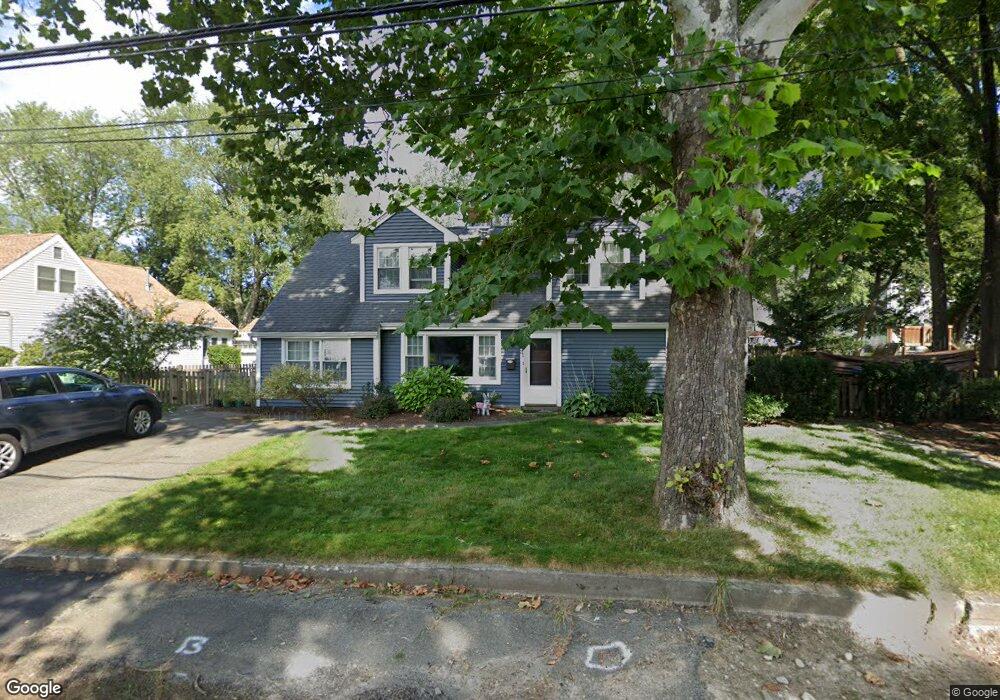
31 Franconia Ave Natick, MA 01760
Estimated Value: $831,155 - $1,027,000
4
Beds
3
Baths
2,069
Sq Ft
$454/Sq Ft
Est. Value
About This Home
This home is located at 31 Franconia Ave, Natick, MA 01760 and is currently estimated at $939,539, approximately $454 per square foot. 31 Franconia Ave is a home located in Middlesex County with nearby schools including Natick High School, Wilson Middle School, and Bennett-Hemenway (Ben-Hem) Elementary School.
Ownership History
Date
Name
Owned For
Owner Type
Purchase Details
Closed on
Oct 2, 2000
Sold by
I & L Ft
Bought by
Bean Lawrence F and Seaton Michelle D
Current Estimated Value
Home Financials for this Owner
Home Financials are based on the most recent Mortgage that was taken out on this home.
Original Mortgage
$191,040
Interest Rate
7.94%
Mortgage Type
Purchase Money Mortgage
Create a Home Valuation Report for This Property
The Home Valuation Report is an in-depth analysis detailing your home's value as well as a comparison with similar homes in the area
Home Values in the Area
Average Home Value in this Area
Purchase History
| Date | Buyer | Sale Price | Title Company |
|---|---|---|---|
| Bean Lawrence F | $238,800 | -- |
Source: Public Records
Mortgage History
| Date | Status | Borrower | Loan Amount |
|---|---|---|---|
| Open | Bean Lawrence F | $262,000 | |
| Closed | Bean Lawrence F | $191,040 | |
| Closed | Bean Lawrence F | $191,040 | |
| Closed | Bean Lawrence F | $23,880 |
Source: Public Records
Tax History
| Year | Tax Paid | Tax Assessment Tax Assessment Total Assessment is a certain percentage of the fair market value that is determined by local assessors to be the total taxable value of land and additions on the property. | Land | Improvement |
|---|---|---|---|---|
| 2025 | $8,744 | $731,100 | $458,300 | $272,800 |
| 2024 | $8,463 | $690,300 | $432,900 | $257,400 |
| 2023 | $8,196 | $648,400 | $406,600 | $241,800 |
| 2022 | $7,940 | $595,200 | $370,400 | $224,800 |
| 2021 | $93 | $559,000 | $350,100 | $208,900 |
| 2020 | $7,401 | $543,800 | $334,900 | $208,900 |
| 2019 | $6,912 | $543,800 | $334,900 | $208,900 |
| 2018 | $4,758 | $495,100 | $304,400 | $190,700 |
| 2017 | $2,846 | $446,600 | $270,500 | $176,100 |
| 2016 | $5,834 | $429,900 | $255,500 | $174,400 |
| 2015 | $5,741 | $415,400 | $255,500 | $159,900 |
Source: Public Records
Map
Nearby Homes
- 7 Jackson Ct Unit B
- 27 2nd St
- 293 Bacon St Unit A
- 36 Winnemay St
- 9 Bellevue Rd
- 20 Florence St Unit B
- 16 Harvard St
- 17 Florence St
- 50 Wethersfield Rd
- 49 Summer St
- 45 Summer St
- 89 W Central St
- 7 High St
- 4 Richard Rd
- 63 Pond St
- 1 Richard Rd
- 12 Bay State Rd
- 3 Vale St Unit A
- 53 Harvard Street Extension
- 25 Irving Rd
Your Personal Tour Guide
Ask me questions while you tour the home.