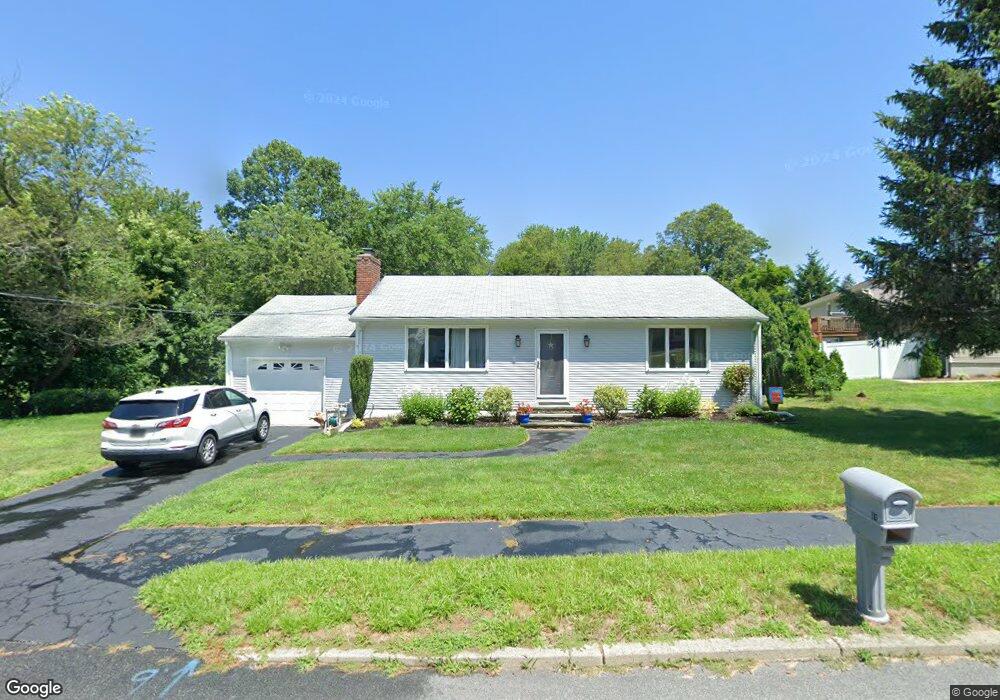
31 Greenview Rd Cranston, RI 02920
Western Cranston NeighborhoodEstimated Value: $419,315 - $485,000
2
Beds
1
Bath
1,040
Sq Ft
$442/Sq Ft
Est. Value
About This Home
This home is located at 31 Greenview Rd, Cranston, RI 02920 and is currently estimated at $459,329, approximately $441 per square foot. 31 Greenview Rd is a home located in Providence County with nearby schools including Glen Hills School, Western Hills Middle School, and Cranston High School West.
Ownership History
Date
Name
Owned For
Owner Type
Purchase Details
Closed on
Nov 30, 2015
Sold by
Lynch Dennis
Bought by
Lynch Kimberly A
Current Estimated Value
Home Financials for this Owner
Home Financials are based on the most recent Mortgage that was taken out on this home.
Original Mortgage
$189,050
Outstanding Balance
$149,100
Interest Rate
3.87%
Estimated Equity
$310,229
Purchase Details
Closed on
Dec 9, 2002
Sold by
Lynch Ronald
Bought by
Lynch Dennis
Create a Home Valuation Report for This Property
The Home Valuation Report is an in-depth analysis detailing your home's value as well as a comparison with similar homes in the area
Home Values in the Area
Average Home Value in this Area
Purchase History
| Date | Buyer | Sale Price | Title Company |
|---|---|---|---|
| Lynch Kimberly A | $199,000 | -- | |
| Lynch Dennis | $143,000 | -- |
Source: Public Records
Mortgage History
| Date | Status | Borrower | Loan Amount |
|---|---|---|---|
| Open | Lynch Dennis | $189,050 | |
| Previous Owner | Lynch Dennis | $274,500 | |
| Previous Owner | Lynch Dennis | $130,000 | |
| Previous Owner | Lynch Dennis | $130,000 |
Source: Public Records
Tax History
| Year | Tax Paid | Tax Assessment Tax Assessment Total Assessment is a certain percentage of the fair market value that is determined by local assessors to be the total taxable value of land and additions on the property. | Land | Improvement |
|---|---|---|---|---|
| 2025 | $4,884 | $351,900 | $121,000 | $230,900 |
| 2024 | $4,789 | $351,900 | $121,000 | $230,900 |
| 2023 | $4,774 | $252,600 | $83,400 | $169,200 |
| 2022 | $4,676 | $252,600 | $83,400 | $169,200 |
| 2021 | $4,547 | $252,600 | $83,400 | $169,200 |
| 2020 | $4,484 | $215,900 | $87,400 | $128,500 |
| 2019 | $4,484 | $215,900 | $87,400 | $128,500 |
| 2018 | $4,381 | $215,900 | $87,400 | $128,500 |
| 2017 | $4,473 | $195,000 | $79,500 | $115,500 |
| 2016 | $4,378 | $195,000 | $79,500 | $115,500 |
| 2015 | $4,378 | $195,000 | $79,500 | $115,500 |
| 2014 | $4,305 | $188,500 | $79,500 | $109,000 |
Source: Public Records
Map
Nearby Homes
- 42 Woodland Dr
- 61 Crossland Rd
- 0 Natick Rd
- 62 Governors Hill Unit 572
- 25 Wilson St
- 15 Gilcrest Dr
- 12 Railroad Row
- 8 Lily Ln Unit 8
- 744 Providence St
- 15 Carrie Ann Dr
- 14 W Natick Rd
- 9 Odonnell Ave
- 1715 Phenix Ave
- 46 Hornbeam Dr
- 52 Jambray Ave
- 5 High St
- 312 Wakefield St
- 8 Ashton Ct
- 78 Wilbur Ave
- 12 W Valley Cir
Your Personal Tour Guide
Ask me questions while you tour the home.