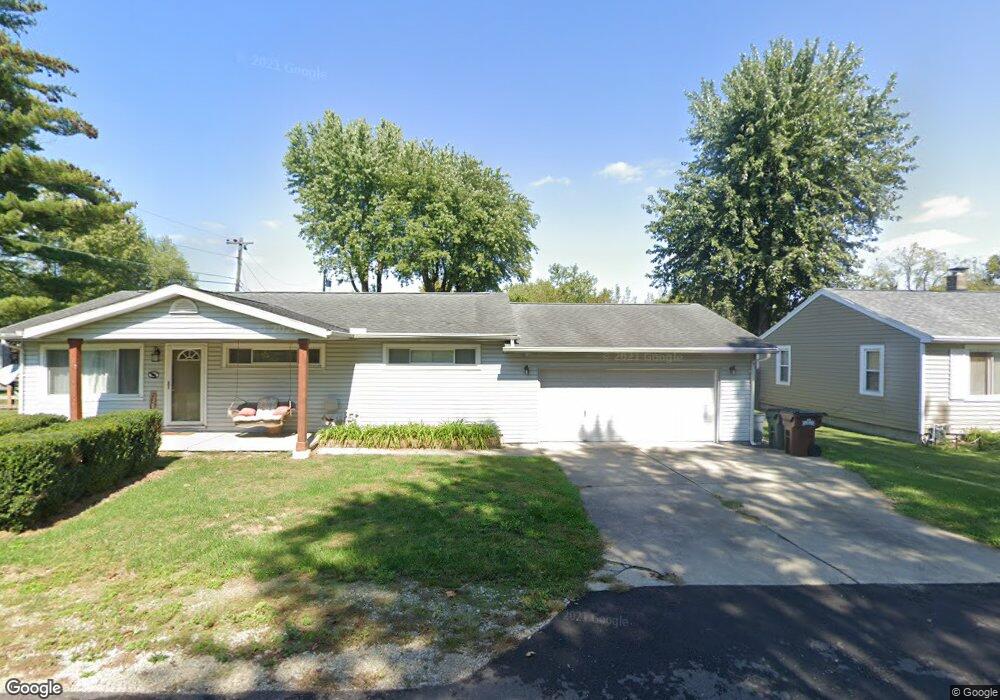
31 Hale Ln Germantown, OH 45327
Estimated Value: $246,550 - $268,000
4
Beds
2
Baths
1,400
Sq Ft
$183/Sq Ft
Est. Value
About This Home
This home is located at 31 Hale Ln, Germantown, OH 45327 and is currently estimated at $256,388, approximately $183 per square foot. 31 Hale Ln is a home located in Montgomery County with nearby schools including Valley View Intermediate School, Valley View Primary School, and Valley View Junior High School.
Ownership History
Date
Name
Owned For
Owner Type
Purchase Details
Closed on
Jun 15, 2021
Sold by
Brunk Joshua J and Wilson Kelsie S
Bought by
Brunk Joshua J
Current Estimated Value
Home Financials for this Owner
Home Financials are based on the most recent Mortgage that was taken out on this home.
Original Mortgage
$149,590
Outstanding Balance
$135,393
Interest Rate
2.88%
Mortgage Type
VA
Estimated Equity
$120,995
Purchase Details
Closed on
Jun 26, 2019
Sold by
King Daniel R and King Cynthia Wallace
Bought by
Brunk Joshua J
Home Financials for this Owner
Home Financials are based on the most recent Mortgage that was taken out on this home.
Original Mortgage
$156,119
Interest Rate
3.82%
Mortgage Type
VA
Purchase Details
Closed on
May 4, 2001
Sold by
King Diann R
Bought by
King Daniel R
Create a Home Valuation Report for This Property
The Home Valuation Report is an in-depth analysis detailing your home's value as well as a comparison with similar homes in the area
Home Values in the Area
Average Home Value in this Area
Purchase History
| Date | Buyer | Sale Price | Title Company |
|---|---|---|---|
| Brunk Joshua J | -- | Boston National Ttl Agcy Llc | |
| Brunk Joshua J | $155,000 | Wave Title Agency | |
| King Daniel R | -- | -- |
Source: Public Records
Mortgage History
| Date | Status | Borrower | Loan Amount |
|---|---|---|---|
| Open | Brunk Joshua J | $149,590 | |
| Closed | Brunk Joshua J | $156,119 |
Source: Public Records
Tax History Compared to Growth
Tax History
| Year | Tax Paid | Tax Assessment Tax Assessment Total Assessment is a certain percentage of the fair market value that is determined by local assessors to be the total taxable value of land and additions on the property. | Land | Improvement |
|---|---|---|---|---|
| 2024 | $3,681 | $72,880 | $8,460 | $64,420 |
| 2023 | $3,681 | $72,880 | $8,460 | $64,420 |
| 2022 | $2,786 | $46,160 | $5,360 | $40,800 |
| 2021 | $2,856 | $46,160 | $5,360 | $40,800 |
| 2020 | $2,807 | $46,160 | $5,360 | $40,800 |
| 2019 | $2,014 | $32,480 | $5,360 | $27,120 |
| 2018 | $2,016 | $32,480 | $5,360 | $27,120 |
| 2017 | $2,001 | $32,480 | $5,360 | $27,120 |
| 2016 | $2,004 | $32,480 | $5,360 | $27,120 |
| 2015 | $1,960 | $32,480 | $5,360 | $27,120 |
| 2014 | $1,960 | $32,480 | $5,360 | $27,120 |
| 2012 | -- | $26,120 | $5,360 | $20,760 |
Source: Public Records
Map
Nearby Homes
- 843 E Center St
- 728 E Market St
- 53 Hawkins Ct
- 00 Ohio 725
- 02 Ohio 725
- 74 Gibraltar Dr
- 428 E Center St
- 114 N Water St
- 8170 Lower Miamisburg Rd
- 135 E Market St
- 55 Hickory Pointe Dr
- 114 S Main St
- 150 N Main St
- 440 N Cherry St
- 149 W Market St
- 175 S Walnut St
- 132 N Walnut St
- 7750 Jamaica Rd
- 0 Farmington Rd Unit 1775475
- 35 Nancy Place