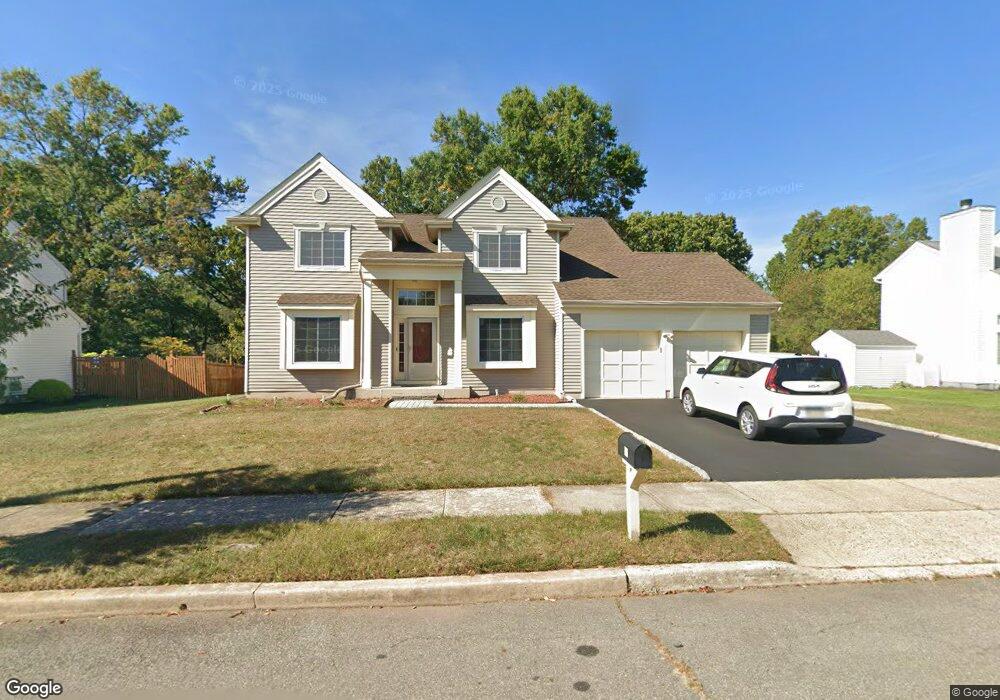
31 Hedgerow St Piscataway, NJ 08854
Estimated Value: $720,000 - $868,000
--
Bed
--
Bath
2,060
Sq Ft
$392/Sq Ft
Est. Value
About This Home
This home is located at 31 Hedgerow St, Piscataway, NJ 08854 and is currently estimated at $806,762, approximately $391 per square foot. 31 Hedgerow St is a home located in Middlesex County with nearby schools including Martin Luther King Intermediate School, Randolphville Elementary School, and Conackamack Middle School.
Ownership History
Date
Name
Owned For
Owner Type
Purchase Details
Closed on
Sep 16, 2004
Sold by
Liang Yin
Bought by
Patel Paresh and Patel Radhika
Current Estimated Value
Home Financials for this Owner
Home Financials are based on the most recent Mortgage that was taken out on this home.
Original Mortgage
$327,000
Outstanding Balance
$161,138
Interest Rate
5.8%
Estimated Equity
$645,624
Purchase Details
Closed on
Sep 19, 1997
Sold by
Warren Marlene
Bought by
Liang Yin and Ji Hong
Home Financials for this Owner
Home Financials are based on the most recent Mortgage that was taken out on this home.
Original Mortgage
$177,000
Interest Rate
7.47%
Purchase Details
Closed on
Mar 4, 1996
Sold by
Vogel John
Bought by
Warren Marlene
Home Financials for this Owner
Home Financials are based on the most recent Mortgage that was taken out on this home.
Original Mortgage
$120,000
Interest Rate
6.97%
Create a Home Valuation Report for This Property
The Home Valuation Report is an in-depth analysis detailing your home's value as well as a comparison with similar homes in the area
Home Values in the Area
Average Home Value in this Area
Purchase History
| Date | Buyer | Sale Price | Title Company |
|---|---|---|---|
| Patel Paresh | $448,000 | -- | |
| Liang Yin | $221,500 | -- | |
| Warren Marlene | $83,227 | -- |
Source: Public Records
Mortgage History
| Date | Status | Borrower | Loan Amount |
|---|---|---|---|
| Open | Patel Paresh | $327,000 | |
| Previous Owner | Liang Yin | $177,000 | |
| Previous Owner | Warren Marlene | $120,000 |
Source: Public Records
Tax History Compared to Growth
Tax History
| Year | Tax Paid | Tax Assessment Tax Assessment Total Assessment is a certain percentage of the fair market value that is determined by local assessors to be the total taxable value of land and additions on the property. | Land | Improvement |
|---|---|---|---|---|
| 2025 | $12,677 | $710,500 | $378,600 | $331,900 |
| 2024 | $12,392 | $647,800 | $244,300 | $403,500 |
| 2023 | $12,392 | $592,900 | $244,300 | $348,600 |
| 2022 | $12,023 | $533,900 | $244,300 | $289,600 |
| 2021 | $11,324 | $483,500 | $224,300 | $259,200 |
| 2020 | $11,337 | $485,300 | $224,300 | $261,000 |
| 2019 | $11,602 | $488,300 | $224,300 | $264,000 |
| 2018 | $11,212 | $472,700 | $224,300 | $248,400 |
| 2017 | $12,589 | $459,300 | $209,300 | $250,000 |
| 2016 | $12,355 | $459,300 | $209,300 | $250,000 |
| 2015 | $12,181 | $459,300 | $209,300 | $250,000 |
| 2014 | $11,905 | $459,300 | $209,300 | $250,000 |
Source: Public Records
Map
Nearby Homes