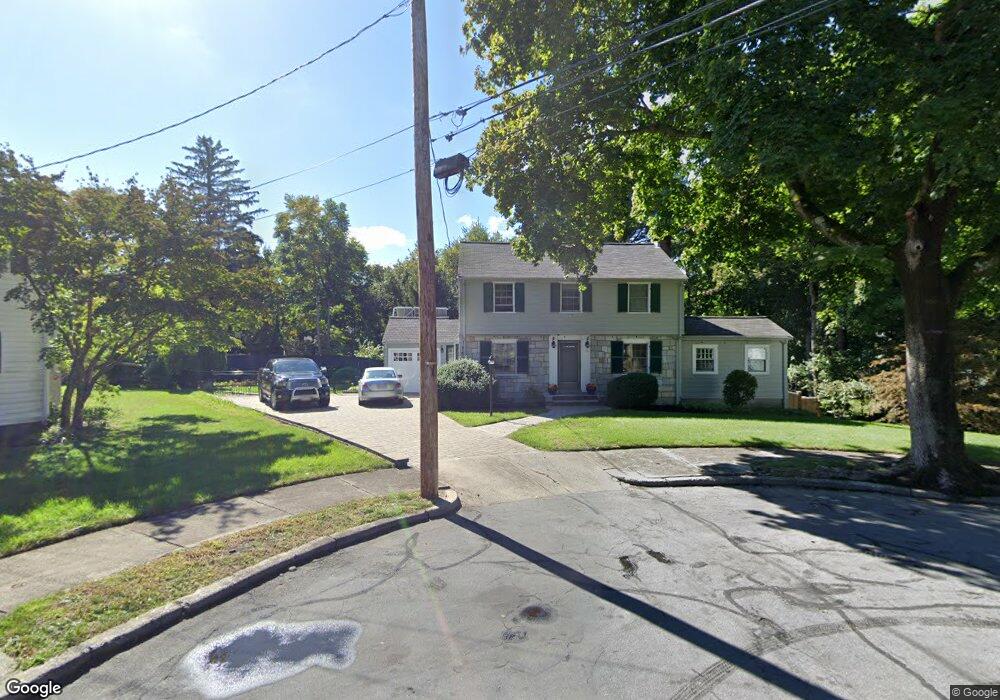
31 Ithaca Cir Newton Lower Falls, MA 02462
Newton Lower Falls NeighborhoodEstimated Value: $1,280,000 - $1,550,000
3
Beds
3
Baths
1,804
Sq Ft
$769/Sq Ft
Est. Value
About This Home
This home is located at 31 Ithaca Cir, Newton Lower Falls, MA 02462 and is currently estimated at $1,387,549, approximately $769 per square foot. 31 Ithaca Cir is a home located in Middlesex County with nearby schools including Angier Elementary School, Charles E Brown Middle School, and Newton South High School.
Ownership History
Date
Name
Owned For
Owner Type
Purchase Details
Closed on
Feb 7, 2023
Sold by
Budge Peter S and Budge Brenda A
Bought by
Budge Ft
Current Estimated Value
Purchase Details
Closed on
Jul 28, 2000
Sold by
Est Budge Donald M and Budge Norman D
Bought by
Budge Peter S and Budge Brenda
Create a Home Valuation Report for This Property
The Home Valuation Report is an in-depth analysis detailing your home's value as well as a comparison with similar homes in the area
Home Values in the Area
Average Home Value in this Area
Purchase History
| Date | Buyer | Sale Price | Title Company |
|---|---|---|---|
| Budge Ft | -- | None Available | |
| Budge Peter S | $220,000 | -- |
Source: Public Records
Mortgage History
| Date | Status | Borrower | Loan Amount |
|---|---|---|---|
| Previous Owner | Budge Peter S | $170,000 | |
| Previous Owner | Budge Peter S | $186,000 |
Source: Public Records
Tax History
| Year | Tax Paid | Tax Assessment Tax Assessment Total Assessment is a certain percentage of the fair market value that is determined by local assessors to be the total taxable value of land and additions on the property. | Land | Improvement |
|---|---|---|---|---|
| 2025 | $11,102 | $1,132,900 | $868,600 | $264,300 |
| 2024 | $10,735 | $1,099,900 | $843,300 | $256,600 |
| 2023 | $10,214 | $1,003,300 | $650,600 | $352,700 |
| 2022 | $9,773 | $929,000 | $602,400 | $326,600 |
| 2021 | $9,430 | $876,400 | $568,300 | $308,100 |
| 2020 | $9,150 | $876,400 | $568,300 | $308,100 |
| 2019 | $8,892 | $850,900 | $551,700 | $299,200 |
| 2018 | $8,500 | $785,600 | $496,500 | $289,100 |
| 2017 | $8,241 | $741,100 | $468,400 | $272,700 |
| 2016 | $7,882 | $692,600 | $437,800 | $254,800 |
| 2015 | $7,515 | $647,300 | $409,200 | $238,100 |
Source: Public Records
Map
Nearby Homes
Your Personal Tour Guide
Ask me questions while you tour the home.