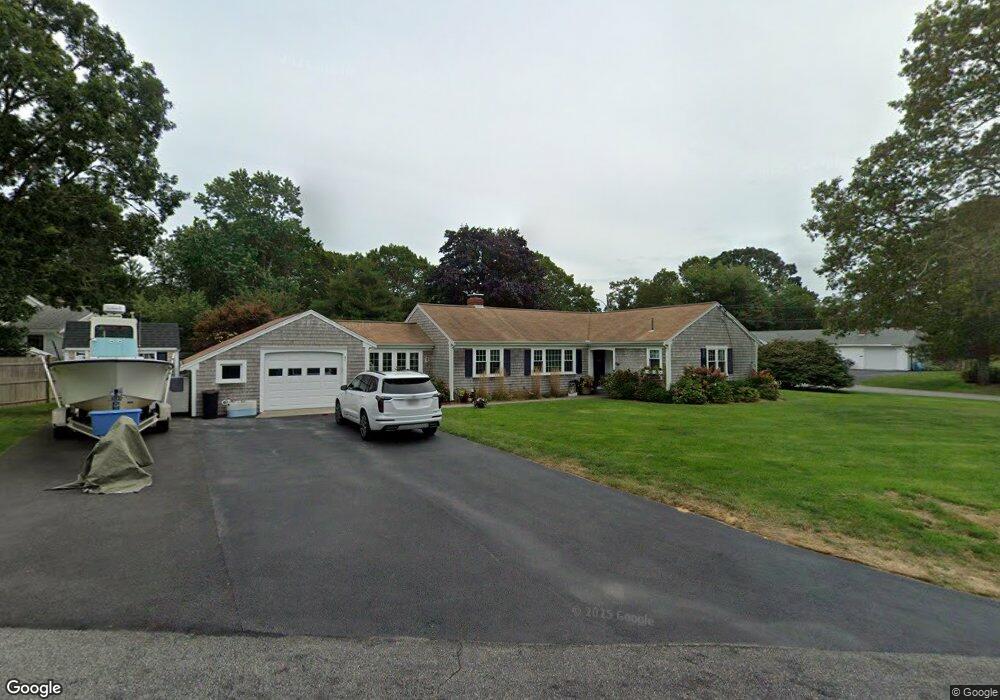
31 James St South Yarmouth, MA 02664
Estimated Value: $524,000 - $649,969
3
Beds
3
Baths
1,522
Sq Ft
$394/Sq Ft
Est. Value
About This Home
This home is located at 31 James St, South Yarmouth, MA 02664 and is currently estimated at $599,992, approximately $394 per square foot. 31 James St is a home located in Barnstable County with nearby schools including Dennis-Yarmouth Regional High School and St. Pius X. School.
Ownership History
Date
Name
Owned For
Owner Type
Purchase Details
Closed on
Aug 25, 2020
Sold by
Brides Michael G
Bought by
Brides Michael G and Brides Danielle
Current Estimated Value
Home Financials for this Owner
Home Financials are based on the most recent Mortgage that was taken out on this home.
Original Mortgage
$123,500
Outstanding Balance
$88,131
Interest Rate
2.9%
Mortgage Type
New Conventional
Estimated Equity
$511,861
Purchase Details
Closed on
Oct 6, 2011
Sold by
Richman Priscilla F
Bought by
Brides Michael G
Home Financials for this Owner
Home Financials are based on the most recent Mortgage that was taken out on this home.
Original Mortgage
$151,500
Interest Rate
4.4%
Mortgage Type
FHA
Create a Home Valuation Report for This Property
The Home Valuation Report is an in-depth analysis detailing your home's value as well as a comparison with similar homes in the area
Home Values in the Area
Average Home Value in this Area
Purchase History
| Date | Buyer | Sale Price | Title Company |
|---|---|---|---|
| Brides Michael G | -- | None Available | |
| Brides Michael G | $170,000 | -- |
Source: Public Records
Mortgage History
| Date | Status | Borrower | Loan Amount |
|---|---|---|---|
| Open | Brides Michael G | $123,500 | |
| Previous Owner | Brides Michael G | $151,500 |
Source: Public Records
Tax History Compared to Growth
Tax History
| Year | Tax Paid | Tax Assessment Tax Assessment Total Assessment is a certain percentage of the fair market value that is determined by local assessors to be the total taxable value of land and additions on the property. | Land | Improvement |
|---|---|---|---|---|
| 2025 | $4,155 | $586,800 | $184,000 | $402,800 |
| 2024 | $3,880 | $525,800 | $155,600 | $370,200 |
| 2023 | $3,759 | $463,500 | $134,700 | $328,800 |
| 2022 | $3,529 | $384,400 | $122,400 | $262,000 |
| 2021 | $3,294 | $344,600 | $122,400 | $222,200 |
| 2020 | $3,208 | $320,800 | $122,400 | $198,400 |
| 2019 | $2,950 | $292,100 | $122,400 | $169,700 |
| 2018 | $2,623 | $254,900 | $104,300 | $150,600 |
| 2017 | $2,508 | $250,300 | $99,700 | $150,600 |
| 2016 | $2,408 | $241,300 | $90,700 | $150,600 |
| 2015 | $2,302 | $229,300 | $90,700 | $138,600 |
Source: Public Records
Map
Nearby Homes