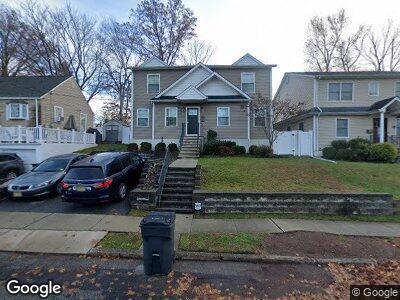
31 John Place Bergenfield, NJ 07621
Estimated Value: $914,000 - $1,053,000
--
Bed
--
Bath
936
Sq Ft
$1,039/Sq Ft
Est. Value
About This Home
This home is located at 31 John Place, Bergenfield, NJ 07621 and is currently estimated at $972,803, approximately $1,039 per square foot. 31 John Place is a home located in Bergen County with nearby schools including Bergenfield High School and Torah Academy of Bergen County.
Ownership History
Date
Name
Owned For
Owner Type
Purchase Details
Closed on
Apr 28, 2014
Sold by
Fc Investments Corporation
Bought by
Slomnicki Joshua Alan and Slomnicki Esther Fradel
Current Estimated Value
Home Financials for this Owner
Home Financials are based on the most recent Mortgage that was taken out on this home.
Original Mortgage
$448,000
Interest Rate
4.41%
Mortgage Type
New Conventional
Purchase Details
Closed on
Jun 19, 2013
Sold by
Hilliard John M and Steiner Barbara
Bought by
Fc Investments Corp
Home Financials for this Owner
Home Financials are based on the most recent Mortgage that was taken out on this home.
Original Mortgage
$150,000
Interest Rate
3.59%
Mortgage Type
Unknown
Purchase Details
Closed on
Dec 14, 2007
Sold by
Hilliard Rose M
Bought by
Hilliard Rose M and Hilliard John M
Create a Home Valuation Report for This Property
The Home Valuation Report is an in-depth analysis detailing your home's value as well as a comparison with similar homes in the area
Home Values in the Area
Average Home Value in this Area
Purchase History
| Date | Buyer | Sale Price | Title Company |
|---|---|---|---|
| Slomnicki Joshua Alan | -- | Berkshire Abstract Title | |
| Slominicki Joshua Alan | $560,000 | -- | |
| Fc Investments Corp | $200,000 | -- | |
| Hilliard Rose M | -- | -- |
Source: Public Records
Mortgage History
| Date | Status | Borrower | Loan Amount |
|---|---|---|---|
| Open | Slomnicki Joshua Alan | $424,000 | |
| Previous Owner | Slominicki Joshua Alan | $448,000 | |
| Previous Owner | Slomnicki Joshua Alan | $463,000 | |
| Previous Owner | Fc Investments Corporation | $150,000 |
Source: Public Records
Tax History Compared to Growth
Tax History
| Year | Tax Paid | Tax Assessment Tax Assessment Total Assessment is a certain percentage of the fair market value that is determined by local assessors to be the total taxable value of land and additions on the property. | Land | Improvement |
|---|---|---|---|---|
| 2024 | $18,697 | $548,300 | $168,800 | $379,500 |
| 2023 | $18,406 | $548,300 | $168,800 | $379,500 |
| 2022 | $18,406 | $548,300 | $168,800 | $379,500 |
| 2021 | $17,863 | $548,300 | $168,800 | $379,500 |
| 2020 | $18,094 | $548,300 | $168,800 | $379,500 |
| 2019 | $17,886 | $548,300 | $168,800 | $379,500 |
| 2018 | $17,754 | $548,300 | $168,800 | $379,500 |
| 2017 | $17,666 | $548,300 | $168,800 | $379,500 |
| 2016 | $17,387 | $548,300 | $168,800 | $379,500 |
| 2015 | $17,521 | $522,400 | $168,800 | $353,600 |
| 2014 | $16,012 | $245,300 | $168,800 | $76,500 |
Source: Public Records
Map
Nearby Homes
- 31 John Place
- 35 John Place
- 27 John Place
- 39 John Place
- 23 John Place
- 338 S Prospect Ave
- 332 S Prospect Ave
- 342 S Prospect Ave
- 43 John Place
- 19 John Place
- 326 S Prospect Ave
- 30 John Place
- 348 S Prospect Ave
- 26 John Place
- 34 John Place
- 322 S Prospect Ave
- 22 John Place
- 38 John Place
- 352 S Prospect Ave
- 11 Gordon Rd