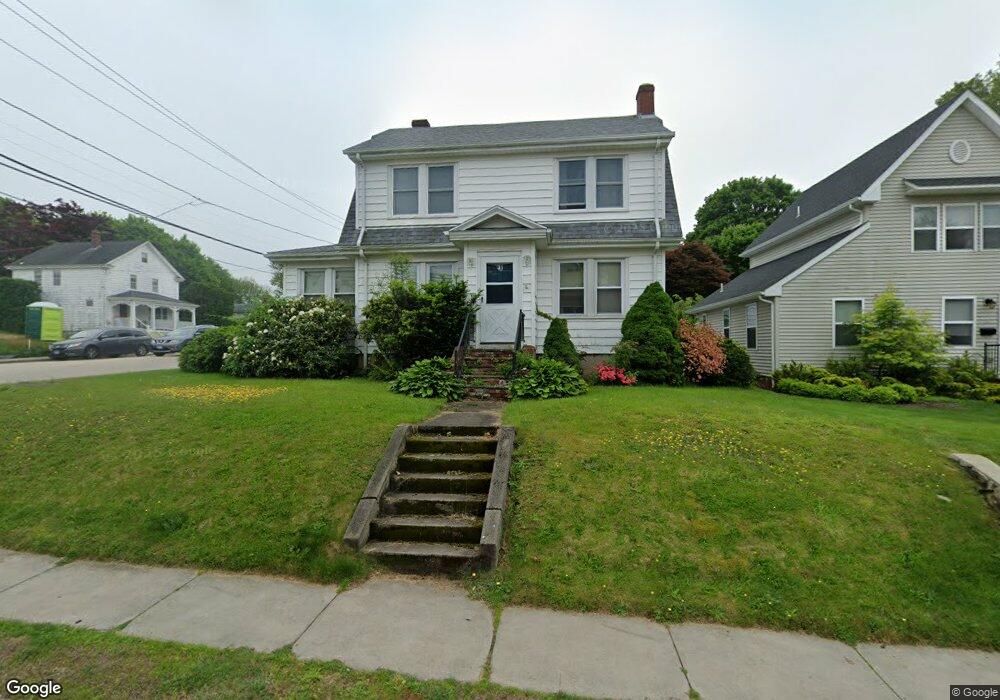
31 John St Westerly, RI 02891
Estimated Value: $460,992 - $496,000
3
Beds
2
Baths
1,329
Sq Ft
$356/Sq Ft
Est. Value
About This Home
This home is located at 31 John St, Westerly, RI 02891 and is currently estimated at $472,498, approximately $355 per square foot. 31 John St is a home located in Washington County with nearby schools including Westerly High School and St. Michael School.
Ownership History
Date
Name
Owned For
Owner Type
Purchase Details
Closed on
Jul 22, 2024
Sold by
Quaratella Grace M
Bought by
Grace M Quaratella T M and Grace Quaratella
Current Estimated Value
Purchase Details
Closed on
Aug 5, 2020
Sold by
Quaratella Grace and Quaratella Joseph J
Bought by
Grace M Quaratella T M and Grace Quaratella
Create a Home Valuation Report for This Property
The Home Valuation Report is an in-depth analysis detailing your home's value as well as a comparison with similar homes in the area
Home Values in the Area
Average Home Value in this Area
Purchase History
| Date | Buyer | Sale Price | Title Company |
|---|---|---|---|
| Grace M Quaratella T M | -- | None Available | |
| Grace M Quaratella T M | -- | None Available | |
| Quaratella Grace M | -- | None Available | |
| Grace M Quaratella T M | -- | None Available | |
| Grace M Quaratella T | -- | None Available | |
| Grace M Quaratella T M | -- | None Available |
Source: Public Records
Tax History
| Year | Tax Paid | Tax Assessment Tax Assessment Total Assessment is a certain percentage of the fair market value that is determined by local assessors to be the total taxable value of land and additions on the property. | Land | Improvement |
|---|---|---|---|---|
| 2025 | $2,967 | $381,300 | $149,400 | $231,900 |
| 2024 | $3,006 | $287,700 | $106,700 | $181,000 |
| 2023 | $2,923 | $287,700 | $106,700 | $181,000 |
| 2022 | $2,906 | $287,700 | $106,700 | $181,000 |
| 2021 | $2,917 | $241,900 | $92,800 | $149,100 |
| 2020 | $2,867 | $241,900 | $92,800 | $149,100 |
| 2019 | $2,840 | $241,900 | $92,800 | $149,100 |
| 2018 | $2,722 | $220,400 | $92,800 | $127,600 |
| 2017 | $2,645 | $220,400 | $92,800 | $127,600 |
| 2016 | $2,645 | $220,400 | $92,800 | $127,600 |
| 2015 | $2,531 | $225,400 | $94,700 | $130,700 |
| 2014 | $2,491 | $225,400 | $94,700 | $130,700 |
Source: Public Records
Map
Nearby Homes
- 16 Spring St
- 25 School St Unit 2
- 21 North Dr
- 19 Crestview Dr Unit C
- 23 Abbey Ln Unit 12
- 24 Abbey Ln Unit 13
- 15 Moss St
- 13 Moss St
- 21 Linden St
- 141 W Broad St
- 33 Whipple Ave
- 22 Colonial Dr
- 19 Lathrop Ave
- 12 Apache Dr Unit A
- 17 Apache Dr Unit G
- 19 Apache Dr Unit F
- 19 Apache Dr Unit 19C
- 55 Pleasant St
- 0 Iroquois Ave
- 2 Marichris Dr
Your Personal Tour Guide
Ask me questions while you tour the home.