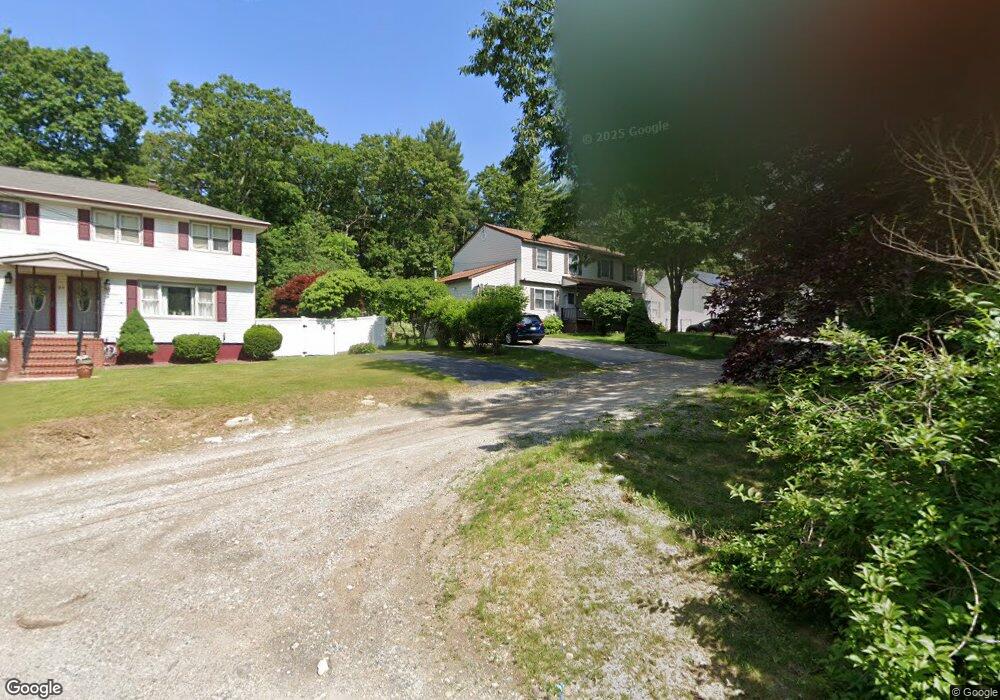
31 Joppa Rd Worcester, MA 01602
West Tatnuck NeighborhoodEstimated Value: $401,000 - $448,000
4
Beds
2
Baths
1,420
Sq Ft
$295/Sq Ft
Est. Value
About This Home
This home is located at 31 Joppa Rd, Worcester, MA 01602 and is currently estimated at $419,203, approximately $295 per square foot. 31 Joppa Rd is a home located in Worcester County with nearby schools including West Tatnuck School, Chandler Magnet, and Jacob Hiatt Magnet School.
Ownership History
Date
Name
Owned For
Owner Type
Purchase Details
Closed on
May 20, 2025
Sold by
Wentworth Lori A
Bought by
Law T T and Law Wentworth
Current Estimated Value
Purchase Details
Closed on
Oct 31, 2011
Sold by
Wentworth Ronald V and Wentworth Cheryl A
Bought by
Wentworth Lori A
Home Financials for this Owner
Home Financials are based on the most recent Mortgage that was taken out on this home.
Original Mortgage
$114,400
Interest Rate
4.11%
Mortgage Type
Stand Alone Second
Create a Home Valuation Report for This Property
The Home Valuation Report is an in-depth analysis detailing your home's value as well as a comparison with similar homes in the area
Home Values in the Area
Average Home Value in this Area
Purchase History
| Date | Buyer | Sale Price | Title Company |
|---|---|---|---|
| Law T T | -- | None Available | |
| Law T T | -- | None Available | |
| Wentworth Lori A | -- | -- | |
| Wentworth Lori A | -- | -- | |
| Wentworth Lori A | -- | -- |
Source: Public Records
Mortgage History
| Date | Status | Borrower | Loan Amount |
|---|---|---|---|
| Previous Owner | Wentworth Lori A | $114,400 | |
| Previous Owner | Wentworth Lori A | $75,000 |
Source: Public Records
Tax History
| Year | Tax Paid | Tax Assessment Tax Assessment Total Assessment is a certain percentage of the fair market value that is determined by local assessors to be the total taxable value of land and additions on the property. | Land | Improvement |
|---|---|---|---|---|
| 2025 | $4,586 | $347,700 | $97,900 | $249,800 |
| 2024 | $4,444 | $323,200 | $97,900 | $225,300 |
| 2023 | $4,212 | $293,700 | $85,100 | $208,600 |
| 2022 | $3,783 | $248,700 | $68,100 | $180,600 |
| 2021 | $3,608 | $221,600 | $54,500 | $167,100 |
| 2020 | $3,529 | $207,600 | $54,500 | $153,100 |
| 2019 | $3,393 | $188,500 | $49,000 | $139,500 |
| 2018 | $3,400 | $179,800 | $49,000 | $130,800 |
| 2017 | $3,229 | $168,000 | $49,000 | $119,000 |
| 2016 | $3,149 | $152,800 | $36,400 | $116,400 |
| 2015 | $3,067 | $152,800 | $36,400 | $116,400 |
| 2014 | $2,986 | $152,800 | $36,400 | $116,400 |
Source: Public Records
Map
Nearby Homes
- 21 Baxter St
- 9 Newburn Rd
- 20 Wedgewood Rd
- 432 Mower St
- 8 Sussex Ln
- 58 Wedgewood Rd
- 15 Sunny Hill Dr
- 23 Tiverton Pkwy
- 29 Scenic Dr
- 3 Mower St
- 148A Tory Fort Ln
- 122 Copperfield Rd
- 47R Yarnie Unit 3A
- 47R Yarnie Unit 1B
- 47R Yarnie Unit 2B
- 47R Yarnie Unit 4B
- 47R Yarnie Unit 8B
- 47R Yarnie Unit 5A
- 47R Yarnie Unit 6B
- 47R Yarnie Unit 4A
Your Personal Tour Guide
Ask me questions while you tour the home.