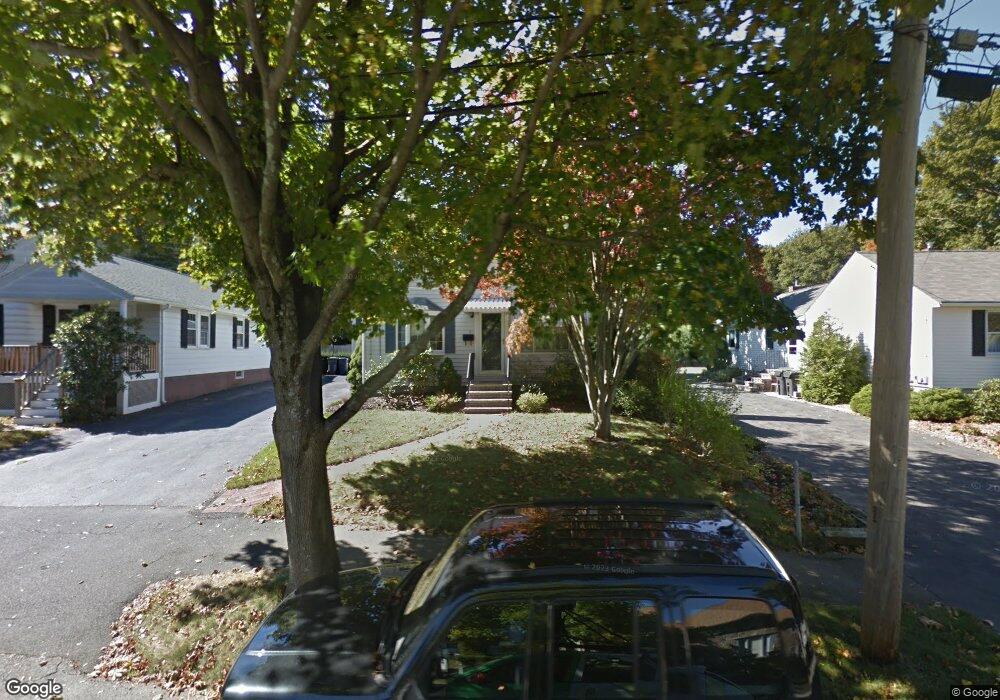
31 Kimball Rd Dedham, MA 02026
The Manor NeighborhoodEstimated Value: $698,014 - $729,000
3
Beds
2
Baths
1,436
Sq Ft
$499/Sq Ft
Est. Value
About This Home
This home is located at 31 Kimball Rd, Dedham, MA 02026 and is currently estimated at $716,754, approximately $499 per square foot. 31 Kimball Rd is a home located in Norfolk County with nearby schools including Greenlodge Elementary School, Dedham Middle School, and Dedham High School.
Ownership History
Date
Name
Owned For
Owner Type
Purchase Details
Closed on
Mar 14, 2018
Sold by
Pignone Christopher J
Bought by
Pignone Christopher J and Pignone Angela M
Current Estimated Value
Purchase Details
Closed on
Jun 28, 2017
Sold by
Est Pignone Marion A and Pignone Christopher J
Bought by
Pignone Christopher J
Home Financials for this Owner
Home Financials are based on the most recent Mortgage that was taken out on this home.
Original Mortgage
$220,000
Interest Rate
4.02%
Mortgage Type
New Conventional
Purchase Details
Closed on
Mar 8, 1963
Bought by
Pignone Marion A
Create a Home Valuation Report for This Property
The Home Valuation Report is an in-depth analysis detailing your home's value as well as a comparison with similar homes in the area
Home Values in the Area
Average Home Value in this Area
Purchase History
| Date | Buyer | Sale Price | Title Company |
|---|---|---|---|
| Pignone Christopher J | -- | -- | |
| Pignone Christopher J | $441,000 | -- | |
| Pignone Marion A | -- | -- |
Source: Public Records
Mortgage History
| Date | Status | Borrower | Loan Amount |
|---|---|---|---|
| Previous Owner | Pignone Christopher J | $220,000 | |
| Previous Owner | Pignone Marion A | $20,000 |
Source: Public Records
Tax History
| Year | Tax Paid | Tax Assessment Tax Assessment Total Assessment is a certain percentage of the fair market value that is determined by local assessors to be the total taxable value of land and additions on the property. | Land | Improvement |
|---|---|---|---|---|
| 2025 | $7,769 | $615,600 | $348,400 | $267,200 |
| 2024 | $7,388 | $591,000 | $316,100 | $274,900 |
| 2023 | $6,958 | $541,900 | $286,300 | $255,600 |
| 2022 | $6,563 | $491,600 | $268,800 | $222,800 |
| 2021 | $6,225 | $455,400 | $248,900 | $206,500 |
| 2020 | $6,148 | $448,100 | $248,900 | $199,200 |
| 2019 | $5,872 | $415,000 | $216,400 | $198,600 |
| 2018 | $5,427 | $373,000 | $189,000 | $184,000 |
| 2017 | $5,328 | $361,000 | $177,000 | $184,000 |
| 2016 | $5,666 | $365,800 | $163,900 | $201,900 |
| 2015 | $5,412 | $341,000 | $163,000 | $178,000 |
| 2014 | $5,142 | $319,800 | $160,100 | $159,700 |
Source: Public Records
Map
Nearby Homes
- 50 Sprague St
- 926 East St
- 22 Azalea Cir
- 45 Circuit Rd
- 59 Hamilton Ave
- 18 Greensboro Rd
- 98 Cedar St Unit 2
- 391 Sprague St
- 6 Snow Ln
- 397 Sprague St
- 44 Holmes Rd
- 12 Blossom St
- 600 East St
- 51 Lancaster Rd
- 2 Leominster Rd
- 88 Durham Rd
- 86 Durham Rd
- 58 Jersey St
- 7 S Stone Mill Dr Unit 403
- 1905 River St Unit 1905
Your Personal Tour Guide
Ask me questions while you tour the home.