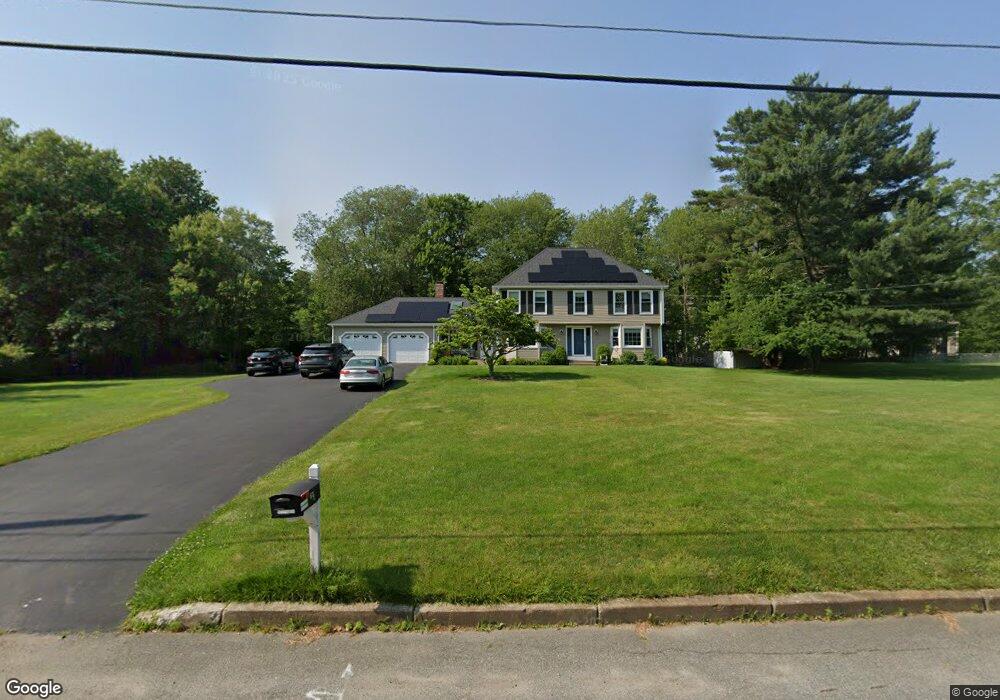
31 King Arthur Rd North Easton, MA 02356
Estimated Value: $834,996 - $881,000
4
Beds
3
Baths
2,162
Sq Ft
$397/Sq Ft
Est. Value
About This Home
This home is located at 31 King Arthur Rd, North Easton, MA 02356 and is currently estimated at $857,249, approximately $396 per square foot. 31 King Arthur Rd is a home located in Bristol County with nearby schools including Easton Middle School.
Ownership History
Date
Name
Owned For
Owner Type
Purchase Details
Closed on
Sep 14, 2020
Sold by
Ross Carolyn D
Bought by
Cdr Ft and Ross
Current Estimated Value
Home Financials for this Owner
Home Financials are based on the most recent Mortgage that was taken out on this home.
Original Mortgage
$375,000
Outstanding Balance
$330,637
Interest Rate
2.8%
Mortgage Type
New Conventional
Estimated Equity
$526,612
Purchase Details
Closed on
Aug 28, 2020
Sold by
Cdr Ft and Ross
Bought by
Ross Carolyn D
Home Financials for this Owner
Home Financials are based on the most recent Mortgage that was taken out on this home.
Original Mortgage
$375,000
Outstanding Balance
$330,637
Interest Rate
2.8%
Mortgage Type
New Conventional
Estimated Equity
$526,612
Purchase Details
Closed on
Aug 29, 2017
Sold by
Ross Carolyn D
Bought by
Cdr Ft and Ross
Purchase Details
Closed on
Mar 27, 2017
Sold by
Carpentier Carolyn D and Carpenter Mark S
Bought by
Ross Carolyn D
Home Financials for this Owner
Home Financials are based on the most recent Mortgage that was taken out on this home.
Original Mortgage
$391,200
Interest Rate
3.5%
Mortgage Type
Adjustable Rate Mortgage/ARM
Purchase Details
Closed on
Jun 24, 1999
Sold by
Richardson Janet W
Bought by
Carpentier Mark S and Carpentier Carolyn D
Create a Home Valuation Report for This Property
The Home Valuation Report is an in-depth analysis detailing your home's value as well as a comparison with similar homes in the area
Home Values in the Area
Average Home Value in this Area
Purchase History
| Date | Buyer | Sale Price | Title Company |
|---|---|---|---|
| Cdr Ft | -- | None Available | |
| Cdr Ft | -- | None Available | |
| Ross Carolyn D | -- | None Available | |
| Ross Carolyn D | -- | None Available | |
| Cdr Ft | -- | -- | |
| Cdr Ft | -- | -- | |
| Ross Carolyn D | -- | -- | |
| Ross Carolyn D | -- | -- | |
| Carpentier Mark S | $275,500 | -- | |
| Carpentier Mark S | $275,500 | -- |
Source: Public Records
Mortgage History
| Date | Status | Borrower | Loan Amount |
|---|---|---|---|
| Open | Ross Carolyn D | $375,000 | |
| Closed | Ross Carolyn D | $375,000 | |
| Previous Owner | Ross Carolyn D | $391,200 | |
| Previous Owner | Carpentier Mark S | $257,000 |
Source: Public Records
Tax History Compared to Growth
Tax History
| Year | Tax Paid | Tax Assessment Tax Assessment Total Assessment is a certain percentage of the fair market value that is determined by local assessors to be the total taxable value of land and additions on the property. | Land | Improvement |
|---|---|---|---|---|
| 2025 | $9,288 | $744,200 | $412,700 | $331,500 |
| 2024 | $9,061 | $678,700 | $348,200 | $330,500 |
| 2023 | $8,879 | $608,600 | $338,900 | $269,700 |
| 2022 | $8,072 | $524,500 | $281,700 | $242,800 |
| 2021 | $7,867 | $508,200 | $265,400 | $242,800 |
| 2020 | $7,632 | $496,200 | $260,400 | $235,800 |
| 2019 | $7,744 | $485,200 | $260,400 | $224,800 |
| 2018 | $7,602 | $469,000 | $260,400 | $208,600 |
| 2017 | $7,378 | $454,900 | $260,400 | $194,500 |
| 2016 | $7,049 | $435,400 | $260,400 | $175,000 |
| 2015 | $6,561 | $391,000 | $216,000 | $175,000 |
| 2014 | $6,474 | $388,800 | $216,000 | $172,800 |
Source: Public Records
Map
Nearby Homes
- 30 King Arthur Rd
- 47 Guinevere Rd
- 17 Gaslight Ln
- 531 Foundry St Unit E
- 531 Foundry St Unit D
- 531 Foundry St Unit A
- 531 Foundry St Unit C
- 555 Foundry St Unit B
- 23 Cutter Dr
- 20 Coach Rd
- Starling Plan at Sawmill Village
- Mallard Plan at Sawmill Village
- Goldfinch Plan at Sawmill Village
- Falcon Plan at Sawmill Village
- Cardinal Plan at Sawmill Village
- Sparrow Plan at Sawmill Village
- 3 Coach Rd
- 64 South St
- 1 Newell Cir
- 32 Heritage Dr
- 27 King Arthur Rd
- 20 Talcott Rd Unit 20
- 24 Talcott Rd Unit 24
- 35 King Arthur Rd
- 16 Talcott Rd Unit 16
- 36 King Arthur Rd
- 23 Talcott Rd Unit 23
- 26 Talcott Rd Unit 26
- 1 Guinevere Rd
- 23 King Arthur Rd
- 19 Talcott Rd Unit 19
- 25 Talcott Rd Unit 25
- 31 Talcott Rd
- 15 Talcott Rd Unit 15
- 29 Talcott Rd Unit 29
- 27 Talcott Rd Unit 27
- 13 Talcott Rd Unit 13
- 40 King Arthur Rd
- 6 Merlin Dr
- 2 Guinevere Rd