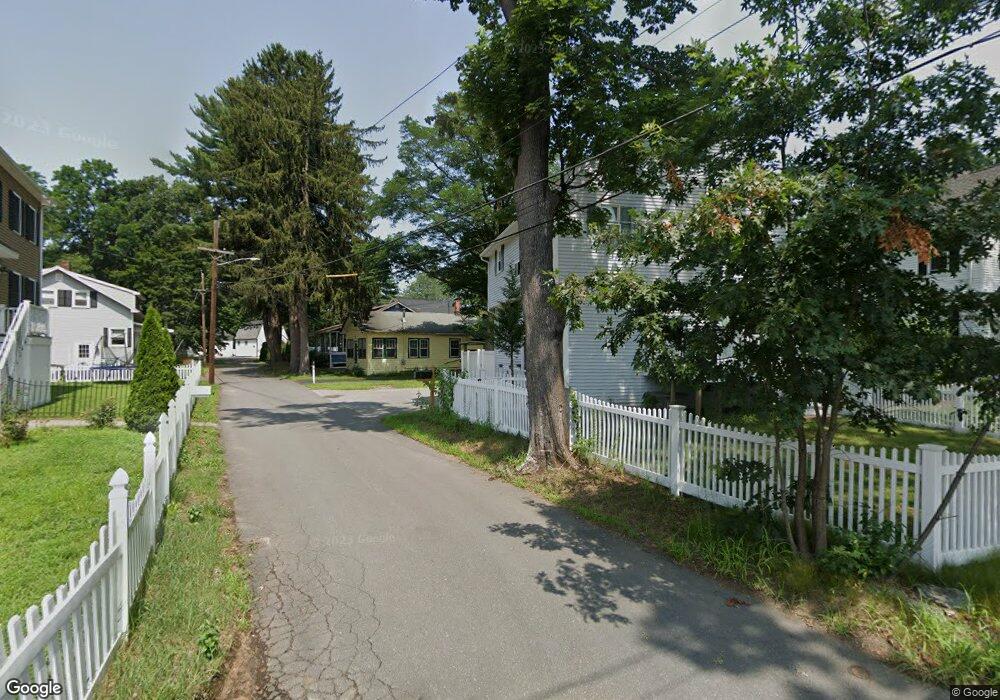
31 Lake St Unit 1 Wilmington, MA 01887
Estimated Value: $788,584 - $865,000
3
Beds
2
Baths
1,700
Sq Ft
$487/Sq Ft
Est. Value
About This Home
This home is located at 31 Lake St Unit 1, Wilmington, MA 01887 and is currently estimated at $827,646, approximately $486 per square foot. 31 Lake St Unit 1 is a home located in Middlesex County with nearby schools including Wilmington Middle School, Wilmington High School, and Abundant Life Christian School and Childcare.
Ownership History
Date
Name
Owned For
Owner Type
Purchase Details
Closed on
Apr 18, 2023
Sold by
Xing Xue C and Wang Hong
Bought by
Zhao Junping
Current Estimated Value
Home Financials for this Owner
Home Financials are based on the most recent Mortgage that was taken out on this home.
Original Mortgage
$180,000
Outstanding Balance
$174,671
Interest Rate
6.65%
Mortgage Type
Purchase Money Mortgage
Estimated Equity
$652,975
Purchase Details
Closed on
Jun 10, 1991
Sold by
Nash Scott A
Bought by
Ward Michael J and Ward Karen M
Purchase Details
Closed on
Feb 9, 1989
Sold by
Warner Russell
Bought by
Nash Scott A
Create a Home Valuation Report for This Property
The Home Valuation Report is an in-depth analysis detailing your home's value as well as a comparison with similar homes in the area
Home Values in the Area
Average Home Value in this Area
Purchase History
| Date | Buyer | Sale Price | Title Company |
|---|---|---|---|
| Zhao Junping | $706,000 | None Available | |
| Ward Michael J | $129,900 | -- | |
| Nash Scott A | $64,900 | -- | |
| Nash Scott A | $64,900 | -- |
Source: Public Records
Mortgage History
| Date | Status | Borrower | Loan Amount |
|---|---|---|---|
| Open | Zhao Junping | $180,000 | |
| Previous Owner | Nash Scott A | $43,000 | |
| Previous Owner | Nash Scott A | $235,000 |
Source: Public Records
Tax History Compared to Growth
Tax History
| Year | Tax Paid | Tax Assessment Tax Assessment Total Assessment is a certain percentage of the fair market value that is determined by local assessors to be the total taxable value of land and additions on the property. | Land | Improvement |
|---|---|---|---|---|
| 2025 | $7,417 | $647,800 | $268,900 | $378,900 |
| 2024 | $7,225 | $632,100 | $268,900 | $363,200 |
| 2023 | $6,466 | $541,500 | $244,400 | $297,100 |
| 2022 | $6,071 | $465,900 | $203,700 | $262,200 |
| 2021 | $5,989 | $432,700 | $185,200 | $247,500 |
| 2020 | $5,736 | $422,400 | $185,200 | $237,200 |
| 2019 | $5,541 | $403,000 | $176,300 | $226,700 |
| 2018 | $5,402 | $374,900 | $167,900 | $207,000 |
| 2017 | $5,234 | $362,200 | $159,900 | $202,300 |
| 2016 | $4,894 | $334,500 | $152,300 | $182,200 |
| 2015 | $4,749 | $330,500 | $152,300 | $178,200 |
| 2014 | $4,424 | $310,700 | $145,100 | $165,600 |
Source: Public Records
Map
Nearby Homes