Estimated Value: $121,454 - $169,000
--
Bed
2
Baths
1,298
Sq Ft
$114/Sq Ft
Est. Value
About This Home
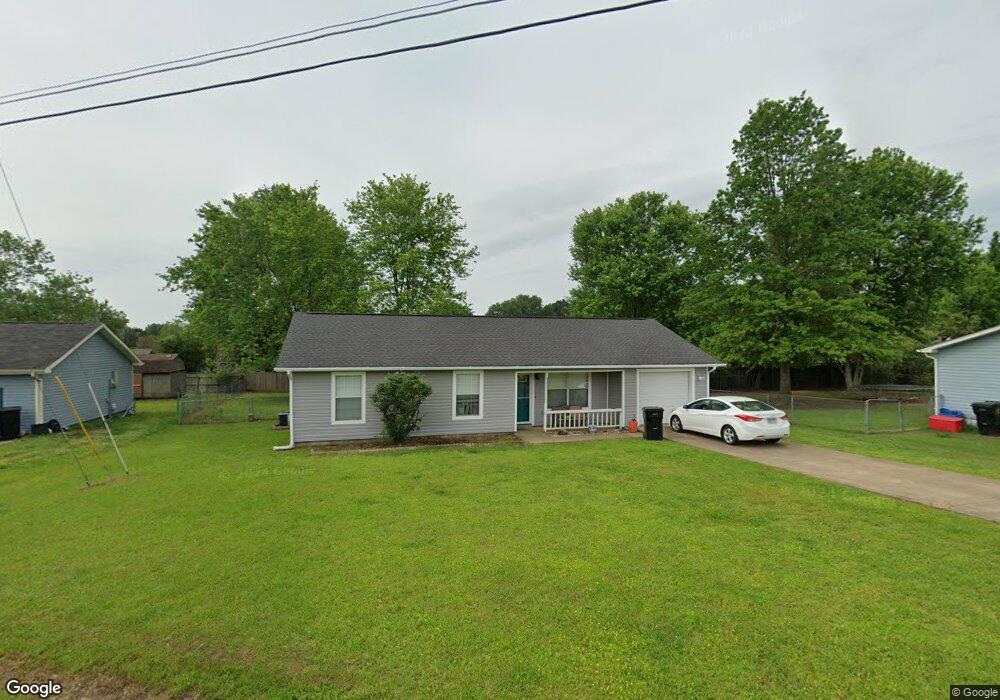
This home is located at 31 Langford St, Ward, AR 72176 and is currently estimated at $147,614, approximately $113 per square foot. 31 Langford St is a home located in Lonoke County with nearby schools including Ward Central Elementary School, Cabot Middle School North, and Cabot Junior High North.
Ownership History
Date
Name
Owned For
Owner Type
Purchase Details
Closed on
Mar 11, 2009
Sold by
Price Lori J and Price Jerry L
Bought by
Mumau Susan
Current Estimated Value
Home Financials for this Owner
Home Financials are based on the most recent Mortgage that was taken out on this home.
Original Mortgage
$80,384
Outstanding Balance
$51,330
Interest Rate
5.21%
Mortgage Type
VA
Estimated Equity
$96,284
Purchase Details
Closed on
Dec 31, 2008
Sold by
Secretary Of Veterans Affairs An Officer
Bought by
Price Lori J and Price Jerry L
Home Financials for this Owner
Home Financials are based on the most recent Mortgage that was taken out on this home.
Original Mortgage
$58,662
Interest Rate
5.42%
Mortgage Type
Construction
Purchase Details
Closed on
Aug 13, 1997
Bought by
Plooster
Purchase Details
Closed on
Aug 24, 1995
Bought by
Duane and Diane Plooster
Purchase Details
Closed on
Apr 17, 1995
Bought by
Kirkland
Create a Home Valuation Report for This Property
The Home Valuation Report is an in-depth analysis detailing your home's value as well as a comparison with similar homes in the area
Home Values in the Area
Average Home Value in this Area
Purchase History
| Date | Buyer | Sale Price | Title Company |
|---|---|---|---|
| Mumau Susan | -- | -- | |
| Price Lori J | -- | -- | |
| Plooster | -- | -- | |
| Duane | $60,000 | -- | |
| Duane | $60,000 | -- | |
| Kirkland | $6,000 | -- |
Source: Public Records
Mortgage History
| Date | Status | Borrower | Loan Amount |
|---|---|---|---|
| Open | Mumau Susan | $80,384 | |
| Previous Owner | Price Lori J | $58,662 |
Source: Public Records
Tax History Compared to Growth
Tax History
| Year | Tax Paid | Tax Assessment Tax Assessment Total Assessment is a certain percentage of the fair market value that is determined by local assessors to be the total taxable value of land and additions on the property. | Land | Improvement |
|---|---|---|---|---|
| 2025 | $430 | $16,790 | $2,000 | $14,790 |
| 2024 | $430 | $16,790 | $2,000 | $14,790 |
| 2023 | $430 | $16,790 | $2,000 | $14,790 |
| 2022 | $480 | $16,790 | $2,000 | $14,790 |
| 2021 | $480 | $16,790 | $2,000 | $14,790 |
| 2020 | $446 | $16,130 | $2,000 | $14,130 |
| 2019 | $446 | $16,130 | $2,000 | $14,130 |
| 2018 | $471 | $16,130 | $2,000 | $14,130 |
| 2017 | $741 | $16,130 | $2,000 | $14,130 |
| 2016 | $446 | $16,130 | $2,000 | $14,130 |
| 2015 | $408 | $14,900 | $2,000 | $12,900 |
| 2014 | $408 | $14,900 | $2,000 | $12,900 |
Source: Public Records
Map
Nearby Homes
- 23 Ariel Dr
- 34 Langford St
- 19 Opal St
- 18 Farrah St
- 204 Bayles St
- 11 Kirkland St
- 405 N Scott St
- 16 Willard St
- 208 Moore St
- 21 Deer Run Dr
- 27 Doe Run Dr
- 34 Fawn Dr
- 35 Green Apple
- 761 Peyton St
- 44 Remington Ln Unit Phase 6 Lot 27 Blo
- 44 Remington Ln
- 48 Remington Ln Unit Phase 6 Lot 25 Bloc
- 48 Remington Ln
- 45 Ten Point Ln Unit Phase 6 Lot 17 Block
- 43 Ten Point Ln Unit Phase 6 Lot 16