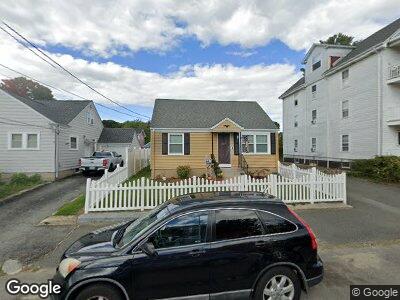
31 Lucas St Pawtucket, RI 02860
Saylesville Highlands NeighborhoodEstimated Value: $307,000 - $355,000
2
Beds
1
Bath
728
Sq Ft
$457/Sq Ft
Est. Value
About This Home
This home is located at 31 Lucas St, Pawtucket, RI 02860 and is currently estimated at $333,054, approximately $457 per square foot. 31 Lucas St is a home located in Providence County with nearby schools including Blackstone Valley Prep Upper Elementary School, Blackstone Valley Prep Junior High School, and Bishop Keough Regional High School.
Ownership History
Date
Name
Owned For
Owner Type
Purchase Details
Closed on
Nov 6, 2022
Sold by
Pandolfi Adelia A
Bought by
A Pandolfi Inter Vivo T
Current Estimated Value
Purchase Details
Closed on
Jul 1, 2021
Sold by
Raymond Raymond L and Raymond I T
Bought by
Pandolfi Adelia A
Create a Home Valuation Report for This Property
The Home Valuation Report is an in-depth analysis detailing your home's value as well as a comparison with similar homes in the area
Home Values in the Area
Average Home Value in this Area
Purchase History
| Date | Buyer | Sale Price | Title Company |
|---|---|---|---|
| A Pandolfi Inter Vivo T | -- | None Available | |
| Pandolfi Adelia A | -- | None Available |
Source: Public Records
Mortgage History
| Date | Status | Borrower | Loan Amount |
|---|---|---|---|
| Open | Adelia Pandolfi Lt | $50,000 | |
| Previous Owner | Pandolfi Adelia A | $160,000 | |
| Previous Owner | Mckay Raymond L | $180,000 | |
| Previous Owner | Rene Raymond | $30,500 |
Source: Public Records
Tax History Compared to Growth
Tax History
| Year | Tax Paid | Tax Assessment Tax Assessment Total Assessment is a certain percentage of the fair market value that is determined by local assessors to be the total taxable value of land and additions on the property. | Land | Improvement |
|---|---|---|---|---|
| 2024 | $3,265 | $264,600 | $126,200 | $138,400 |
| 2023 | $2,968 | $175,200 | $68,800 | $106,400 |
| 2022 | $2,905 | $175,200 | $68,800 | $106,400 |
| 2021 | $2,905 | $175,200 | $68,800 | $106,400 |
| 2020 | $3,094 | $148,100 | $63,400 | $84,700 |
| 2019 | $3,094 | $148,100 | $63,400 | $84,700 |
| 2018 | $2,981 | $148,100 | $63,400 | $84,700 |
| 2017 | $2,990 | $131,600 | $57,500 | $74,100 |
| 2016 | $2,881 | $131,600 | $57,500 | $74,100 |
| 2015 | $2,881 | $131,600 | $57,500 | $74,100 |
| 2014 | $2,836 | $123,000 | $57,500 | $65,500 |
Source: Public Records
Map
Nearby Homes