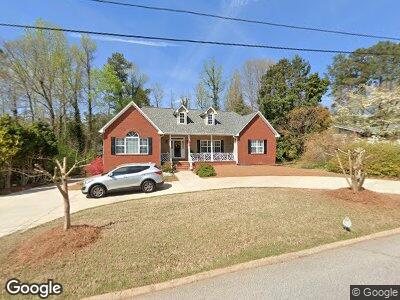
31 Lynda Cir Carrollton, GA 30117
Estimated Value: $277,000 - $307,559
3
Beds
3
Baths
2,366
Sq Ft
$124/Sq Ft
Est. Value
About This Home
This home is located at 31 Lynda Cir, Carrollton, GA 30117 and is currently estimated at $294,390, approximately $124 per square foot. 31 Lynda Cir is a home located in Carroll County with nearby schools including Carrollton Elementary School, Carrollton Upper Elementary School, and Carrollton Middle School.
Ownership History
Date
Name
Owned For
Owner Type
Purchase Details
Closed on
Nov 13, 2020
Sold by
Cheek Russell
Bought by
Jones Lloyd K and Jones Samantha B
Current Estimated Value
Home Financials for this Owner
Home Financials are based on the most recent Mortgage that was taken out on this home.
Original Mortgage
$181,649
Outstanding Balance
$163,999
Interest Rate
2.8%
Mortgage Type
FHA
Estimated Equity
$133,824
Purchase Details
Closed on
Apr 16, 2008
Sold by
United Community Bank
Bought by
Cheek Russell and Cheek Erica
Home Financials for this Owner
Home Financials are based on the most recent Mortgage that was taken out on this home.
Original Mortgage
$95,819
Interest Rate
5.84%
Mortgage Type
FHA
Purchase Details
Closed on
Jan 2, 2008
Sold by
United Community Bank
Bought by
United Community Bank
Purchase Details
Closed on
Apr 10, 2006
Sold by
Not Provided
Bought by
Cheek Russell and Cheek Erica
Purchase Details
Closed on
Apr 29, 2004
Bought by
Mcdowell Dennis H
Create a Home Valuation Report for This Property
The Home Valuation Report is an in-depth analysis detailing your home's value as well as a comparison with similar homes in the area
Home Values in the Area
Average Home Value in this Area
Purchase History
| Date | Buyer | Sale Price | Title Company |
|---|---|---|---|
| Jones Lloyd K | $185,000 | -- | |
| Cheek Russell | $97,323 | -- | |
| United Community Bank | $125,068 | -- | |
| Cheek Russell | $33,000 | -- | |
| Mcdowell Dennis H | -- | -- |
Source: Public Records
Mortgage History
| Date | Status | Borrower | Loan Amount |
|---|---|---|---|
| Open | Jones Lloyd K | $181,649 | |
| Closed | Jones Lloyd K | $181,649 | |
| Previous Owner | Cheek Russell | $95,819 |
Source: Public Records
Tax History Compared to Growth
Tax History
| Year | Tax Paid | Tax Assessment Tax Assessment Total Assessment is a certain percentage of the fair market value that is determined by local assessors to be the total taxable value of land and additions on the property. | Land | Improvement |
|---|---|---|---|---|
| 2024 | $2,777 | $122,767 | $7,400 | $115,367 |
| 2023 | $2,777 | $112,302 | $7,400 | $104,902 |
| 2022 | $2,262 | $90,178 | $6,000 | $84,178 |
| 2021 | $1,897 | $78,084 | $6,000 | $72,084 |
| 2020 | $1,376 | $63,045 | $6,000 | $57,045 |
| 2019 | $1,296 | $58,088 | $6,000 | $52,088 |
| 2018 | $1,088 | $47,333 | $4,000 | $43,333 |
| 2017 | $1,091 | $47,333 | $4,000 | $43,333 |
| 2016 | $1,091 | $47,333 | $4,000 | $43,333 |
| 2015 | $1,043 | $41,298 | $4,000 | $37,299 |
| 2014 | $891 | $35,704 | $4,000 | $31,704 |
Source: Public Records
Map
Nearby Homes