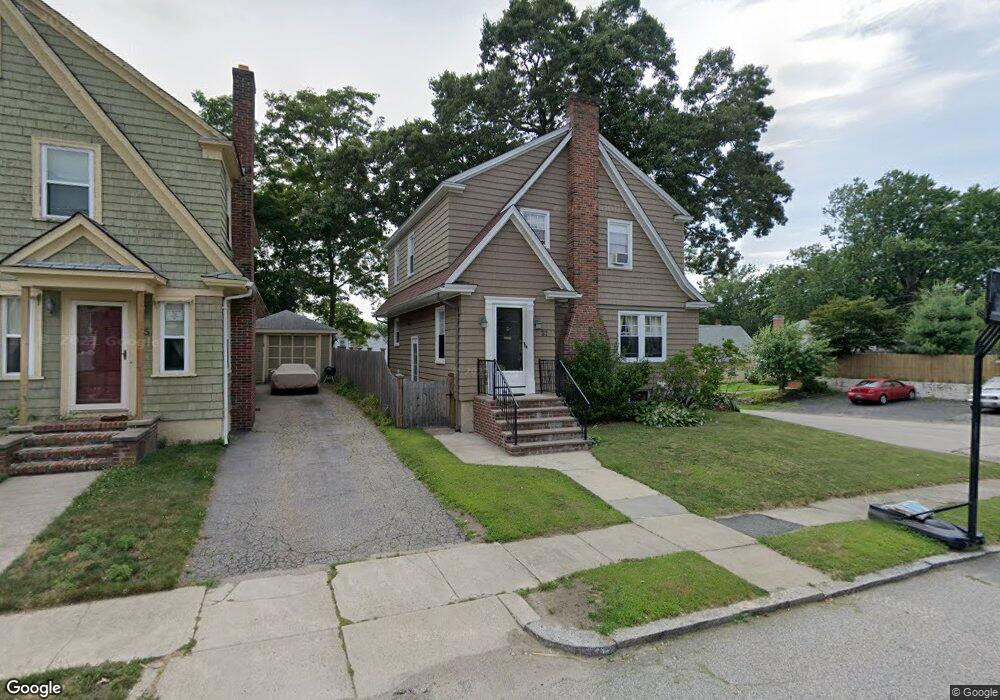
31 Lyndon Rd Cranston, RI 02905
Edgewood NeighborhoodEstimated Value: $430,989 - $465,000
3
Beds
1
Bath
1,568
Sq Ft
$288/Sq Ft
Est. Value
About This Home
This home is located at 31 Lyndon Rd, Cranston, RI 02905 and is currently estimated at $450,997, approximately $287 per square foot. 31 Lyndon Rd is a home located in Providence County with nearby schools including Edgewood Highland Elementary School, Edward S. Rhodes School, and Park View Middle School.
Ownership History
Date
Name
Owned For
Owner Type
Purchase Details
Closed on
Apr 30, 2004
Sold by
Gonzalez Alfredo
Bought by
Adams Christopher and Adams Cheryl
Current Estimated Value
Create a Home Valuation Report for This Property
The Home Valuation Report is an in-depth analysis detailing your home's value as well as a comparison with similar homes in the area
Home Values in the Area
Average Home Value in this Area
Purchase History
| Date | Buyer | Sale Price | Title Company |
|---|---|---|---|
| Adams Christopher | $220,000 | -- |
Source: Public Records
Mortgage History
| Date | Status | Borrower | Loan Amount |
|---|---|---|---|
| Open | Adams Christopher | $170,000 | |
| Closed | Adams Christopher | $210,000 | |
| Closed | Adams Christopher | $110,000 |
Source: Public Records
Tax History Compared to Growth
Tax History
| Year | Tax Paid | Tax Assessment Tax Assessment Total Assessment is a certain percentage of the fair market value that is determined by local assessors to be the total taxable value of land and additions on the property. | Land | Improvement |
|---|---|---|---|---|
| 2025 | $5,029 | $362,300 | $105,600 | $256,700 |
| 2024 | $4,931 | $362,300 | $105,600 | $256,700 |
| 2023 | $4,587 | $242,700 | $69,500 | $173,200 |
| 2022 | $4,478 | $241,900 | $69,500 | $172,400 |
| 2021 | $4,354 | $241,900 | $69,500 | $172,400 |
| 2020 | $4,223 | $203,300 | $66,200 | $137,100 |
| 2019 | $4,223 | $203,300 | $66,200 | $137,100 |
| 2018 | $4,125 | $203,300 | $66,200 | $137,100 |
| 2017 | $3,836 | $167,200 | $59,600 | $107,600 |
| 2016 | $3,754 | $167,200 | $59,600 | $107,600 |
| 2015 | $3,754 | $167,200 | $59,600 | $107,600 |
| 2014 | $3,675 | $160,900 | $59,600 | $101,300 |
Source: Public Records
Map
Nearby Homes
- 35 Lyndon Rd
- 39 Lyndon Rd
- 48 Roger Williams Cir
- 91 Cliffdale Ave
- 52 Roger Williams Cir
- 43 Lyndon Rd
- 82 Cliffdale Ave
- 38 Lyndon Rd
- 21 Lyndon Rd
- 95 Cliffdale Ave
- 40 Lyndon Rd
- 47 Lyndon Rd
- 56 Roger Williams Cir
- 42 Roger Williams Cir
- 83 Cliffdale Ave
- 46 Lyndon Rd
- 101 Cliffdale Ave
- 19 Lyndon Rd
- 81 Cliffdale Ave
- 51 Lyndon Rd