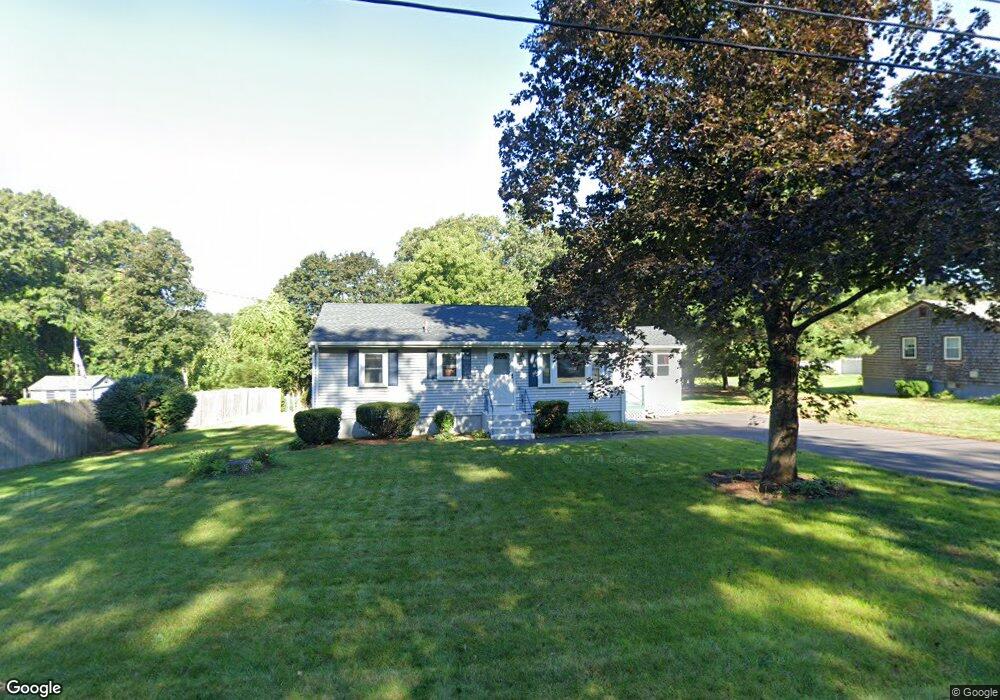
31 Maple St Medway, MA 02053
Estimated Value: $475,268 - $546,000
3
Beds
1
Bath
912
Sq Ft
$571/Sq Ft
Est. Value
About This Home
This home is located at 31 Maple St, Medway, MA 02053 and is currently estimated at $520,817, approximately $571 per square foot. 31 Maple St is a home located in Norfolk County with nearby schools including John D. McGovern Elementary School, Burke-Memorial Elementary, and Medway Middle School.
Ownership History
Date
Name
Owned For
Owner Type
Purchase Details
Closed on
Oct 7, 2008
Sold by
Borghild N Skeans T and Clark Diane F
Bought by
Obrien Robert G
Current Estimated Value
Home Financials for this Owner
Home Financials are based on the most recent Mortgage that was taken out on this home.
Original Mortgage
$203,120
Outstanding Balance
$135,782
Interest Rate
6.54%
Mortgage Type
Purchase Money Mortgage
Estimated Equity
$385,035
Create a Home Valuation Report for This Property
The Home Valuation Report is an in-depth analysis detailing your home's value as well as a comparison with similar homes in the area
Home Values in the Area
Average Home Value in this Area
Purchase History
We collect this data history from publicly available records. To have your information removed, we recommend requesting removal directly through your county’s website.
| Date | Buyer | Sale Price | Title Company |
|---|---|---|---|
| Obrien Robert G | $253,900 | -- |
Source: Public Records
Mortgage History
We collect this data history from publicly available records. To have your information removed, we recommend requesting removal directly through your county’s website.
| Date | Status | Borrower | Loan Amount |
|---|---|---|---|
| Open | Obrien Robert G | $203,120 |
Source: Public Records
Tax History
| Year | Tax Paid | Tax Assessment Tax Assessment Total Assessment is a certain percentage of the fair market value that is determined by local assessors to be the total taxable value of land and additions on the property. | Land | Improvement |
|---|---|---|---|---|
| 2025 | $6,018 | $422,300 | $286,900 | $135,400 |
| 2024 | $6,081 | $422,300 | $286,900 | $135,400 |
| 2023 | $5,557 | $348,600 | $237,700 | $110,900 |
| 2022 | $5,451 | $322,000 | $211,100 | $110,900 |
| 2021 | $5,186 | $297,000 | $194,700 | $102,300 |
| 2020 | $4,947 | $282,700 | $180,400 | $102,300 |
| 2019 | $4,752 | $280,000 | $180,400 | $99,600 |
| 2018 | $4,510 | $255,400 | $155,800 | $99,600 |
| 2017 | $4,493 | $250,700 | $155,800 | $94,900 |
| 2016 | $4,042 | $223,200 | $128,300 | $94,900 |
| 2015 | $3,936 | $215,800 | $120,900 | $94,900 |
| 2014 | $3,934 | $208,800 | $127,100 | $81,700 |
Source: Public Records
Map
Nearby Homes
- 40 Timber Crest Dr
- 26 Timber Crest Dr
- 50 Main St
- 3 Harmony Way Unit 3
- 25 Milford St
- 64 Holliston St
- 34 Broken Tree Rd
- 133 Summer St
- 50 Milford St
- 19 Holliston St
- 204 Village St
- 24 Vernon Rd
- 394 Village St
- 19 Barber St Unit B
- 16 Stable Way
- 20 Broad St Unit 1
- 20 Broad St Unit 5
- 37 North St
- 21 Stable Way
- 10 Timber Ledge Dr
Your Personal Tour Guide
Ask me questions while you tour the home.