Estimated Value: $300,521 - $382,000
2
Beds
2
Baths
1,134
Sq Ft
$296/Sq Ft
Est. Value
About This Home
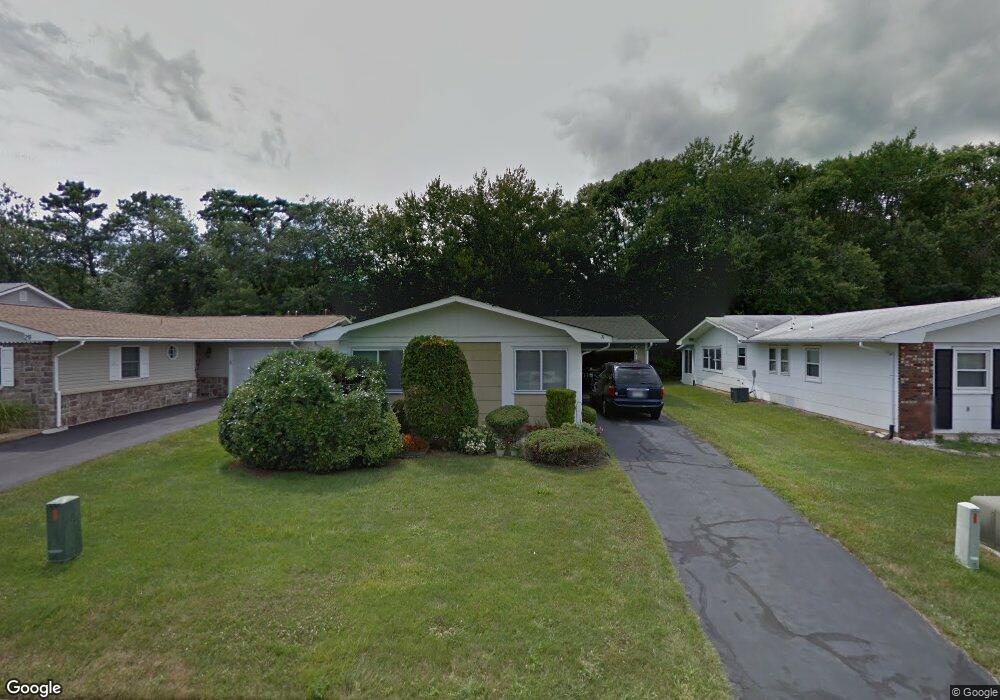
This home is located at 31 Markham Rd, Brick, NJ 08724 and is currently estimated at $335,630, approximately $295 per square foot. 31 Markham Rd is a home located in Ocean County with nearby schools including Lanes Mill Elementary School, Veterans Memorial Middle School, and Brick Township Memorial High School.
Ownership History
Date
Name
Owned For
Owner Type
Purchase Details
Closed on
Dec 15, 2005
Sold by
Freedman Harriet Beverly
Bought by
Shannon Joseph J and Shannon Karen L
Current Estimated Value
Home Financials for this Owner
Home Financials are based on the most recent Mortgage that was taken out on this home.
Original Mortgage
$50,000
Interest Rate
6.27%
Mortgage Type
Fannie Mae Freddie Mac
Create a Home Valuation Report for This Property
The Home Valuation Report is an in-depth analysis detailing your home's value as well as a comparison with similar homes in the area
Home Values in the Area
Average Home Value in this Area
Purchase History
| Date | Buyer | Sale Price | Title Company |
|---|---|---|---|
| Shannon Joseph J | $179,900 | First American Title Ins Co |
Source: Public Records
Mortgage History
| Date | Status | Borrower | Loan Amount |
|---|---|---|---|
| Previous Owner | Shannon Joseph J | $50,000 |
Source: Public Records
Tax History
| Year | Tax Paid | Tax Assessment Tax Assessment Total Assessment is a certain percentage of the fair market value that is determined by local assessors to be the total taxable value of land and additions on the property. | Land | Improvement |
|---|---|---|---|---|
| 2025 | $2,992 | $109,100 | $40,000 | $69,100 |
| 2024 | $2,702 | $109,100 | $40,000 | $69,100 |
| 2023 | $2,663 | $109,100 | $40,000 | $69,100 |
| 2022 | $2,663 | $109,100 | $40,000 | $69,100 |
| 2021 | $2,343 | $109,100 | $40,000 | $69,100 |
| 2020 | $2,574 | $109,100 | $40,000 | $69,100 |
| 2019 | $2,528 | $109,100 | $40,000 | $69,100 |
| 2018 | $2,470 | $109,100 | $40,000 | $69,100 |
| 2017 | $2,403 | $109,100 | $40,000 | $69,100 |
| 2016 | $2,390 | $109,100 | $40,000 | $69,100 |
| 2015 | $2,328 | $109,100 | $40,000 | $69,100 |
| 2014 | $2,309 | $109,100 | $40,000 | $69,100 |
Source: Public Records
Map
Nearby Homes
- 17 Markham Rd
- 49 Markham Rd
- 1722 Burrsville Rd
- 00 Larchmont Ave
- 203 Blake Cir
- 201 Blake Cir
- 6 Hardy Ct
- 159 Clay Cir
- 24 Clay Cir
- 11 The Blvd
- 802 Sandra Place
- 37 Central Blvd
- 42 Sidney Ct
- 10 Arnold St
- 69 Clay Cir
- 45 Tony Ct
- 5 Cherrywood Cir Unit 105
- 30 Rosalind Rd
- 34 Collins Ct
- 47 Cherrywood Cir Unit 147
Your Personal Tour Guide
Ask me questions while you tour the home.