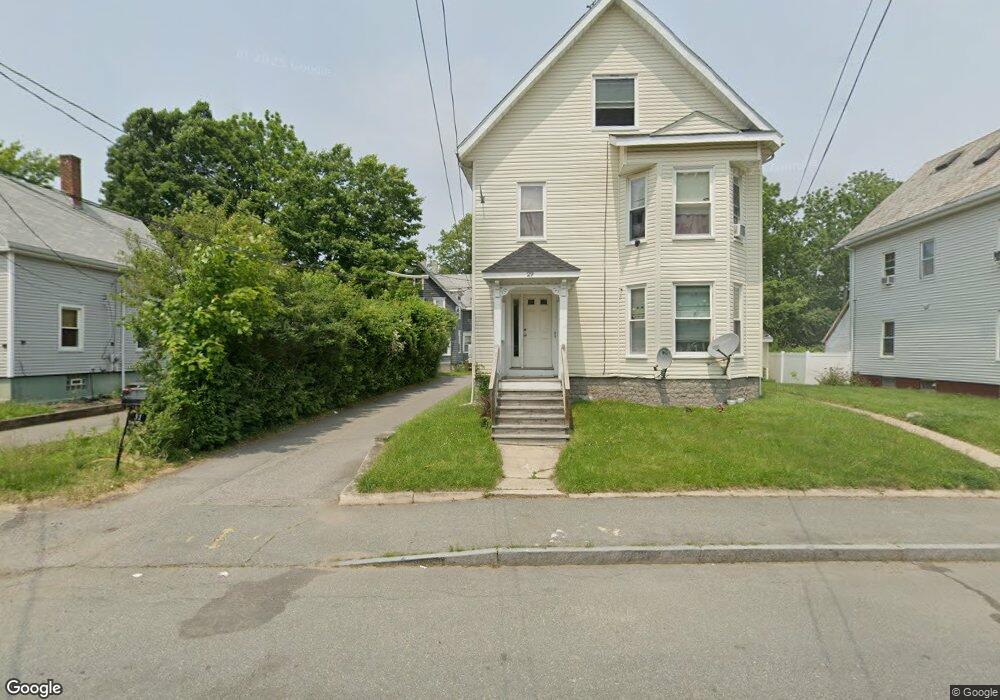
31 Menlo St Brockton, MA 02301
Clifton Heights NeighborhoodEstimated Value: $590,995 - $726,000
3
Beds
2
Baths
1,840
Sq Ft
$364/Sq Ft
Est. Value
About This Home
This home is located at 31 Menlo St, Brockton, MA 02301 and is currently estimated at $670,249, approximately $364 per square foot. 31 Menlo St is a home located in Plymouth County with nearby schools including John F. Kennedy Elementary School, Davis K-8 School, and South Middle School.
Ownership History
Date
Name
Owned For
Owner Type
Purchase Details
Closed on
Feb 7, 2020
Sold by
Richardson Patricia
Bought by
Hatten Cedric F and Hatten Warner
Current Estimated Value
Purchase Details
Closed on
Oct 14, 2005
Sold by
Tabb Lorne R
Bought by
Richardson Patricia
Home Financials for this Owner
Home Financials are based on the most recent Mortgage that was taken out on this home.
Original Mortgage
$349,200
Interest Rate
5.78%
Mortgage Type
Purchase Money Mortgage
Purchase Details
Closed on
Mar 16, 2005
Sold by
Arenburg William L
Bought by
Tabb Lorne R
Home Financials for this Owner
Home Financials are based on the most recent Mortgage that was taken out on this home.
Original Mortgage
$311,505
Interest Rate
5.64%
Mortgage Type
Purchase Money Mortgage
Create a Home Valuation Report for This Property
The Home Valuation Report is an in-depth analysis detailing your home's value as well as a comparison with similar homes in the area
Home Values in the Area
Average Home Value in this Area
Purchase History
| Date | Buyer | Sale Price | Title Company |
|---|---|---|---|
| Hatten Cedric F | $500,000 | None Available | |
| Richardson Patricia | $388,000 | -- | |
| Tabb Lorne R | $327,900 | -- |
Source: Public Records
Mortgage History
| Date | Status | Borrower | Loan Amount |
|---|---|---|---|
| Previous Owner | Tabb Lorne R | $357,200 | |
| Previous Owner | Tabb Lorne R | $349,200 | |
| Previous Owner | Tabb Lorne R | $311,505 |
Source: Public Records
Tax History Compared to Growth
Tax History
| Year | Tax Paid | Tax Assessment Tax Assessment Total Assessment is a certain percentage of the fair market value that is determined by local assessors to be the total taxable value of land and additions on the property. | Land | Improvement |
|---|---|---|---|---|
| 2025 | $6,750 | $557,400 | $140,800 | $416,600 |
| 2024 | $6,604 | $549,400 | $140,800 | $408,600 |
| 2023 | $6,133 | $472,500 | $107,800 | $364,700 |
| 2022 | $6,140 | $439,500 | $98,100 | $341,400 |
| 2021 | $5,581 | $384,900 | $82,200 | $302,700 |
| 2020 | $4,892 | $322,900 | $76,300 | $246,600 |
| 2019 | $5,280 | $339,800 | $74,200 | $265,600 |
| 2018 | $4,489 | $289,000 | $74,200 | $214,800 |
| 2017 | $4,265 | $264,900 | $74,200 | $190,700 |
| 2016 | $4,267 | $245,800 | $72,100 | $173,700 |
| 2015 | $3,425 | $188,700 | $72,100 | $116,600 |
| 2014 | $3,477 | $191,800 | $72,100 | $119,700 |
Source: Public Records
Map
Nearby Homes