Estimated Value: $114,000 - $133,082
3
Beds
2
Baths
1,549
Sq Ft
$80/Sq Ft
Est. Value
About This Home
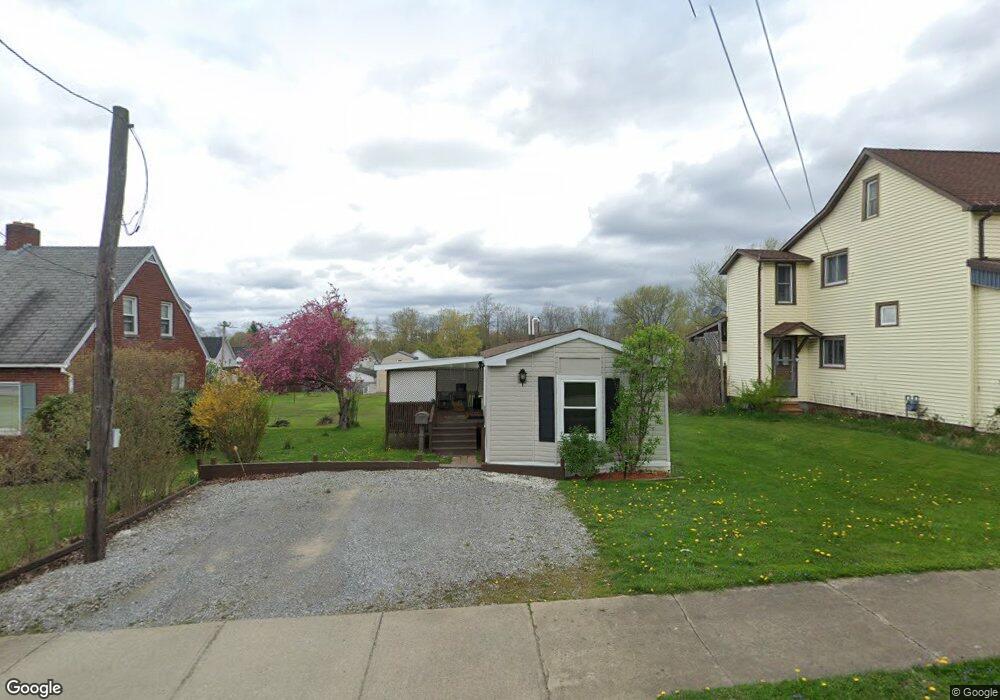
This home is located at 31 N Tionesta Ave, Kane, PA 16735 and is currently estimated at $123,271, approximately $79 per square foot. 31 N Tionesta Ave is a home located in McKean County with nearby schools including Kane Area Elementary School, Kane Area Middle School, and Kane Area High School.
Ownership History
Date
Name
Owned For
Owner Type
Purchase Details
Closed on
Dec 20, 2019
Sold by
Dalton Julie A and Butters Bradley A
Bought by
Carlson Alyssa R
Current Estimated Value
Home Financials for this Owner
Home Financials are based on the most recent Mortgage that was taken out on this home.
Original Mortgage
$61,750
Outstanding Balance
$52,075
Interest Rate
3.7%
Mortgage Type
Commercial
Estimated Equity
$71,196
Purchase Details
Closed on
Jun 26, 2014
Sold by
Wensel Jason R and Wensel Christa A
Bought by
Dalton Julie A
Home Financials for this Owner
Home Financials are based on the most recent Mortgage that was taken out on this home.
Original Mortgage
$64,000
Interest Rate
4.19%
Mortgage Type
Purchase Money Mortgage
Purchase Details
Closed on
Jul 14, 2009
Sold by
Wensel Jason R and Wensel Christa A
Bought by
Wensel Jason R and Wensel Christa A
Home Financials for this Owner
Home Financials are based on the most recent Mortgage that was taken out on this home.
Original Mortgage
$40,500
Interest Rate
5.31%
Mortgage Type
New Conventional
Create a Home Valuation Report for This Property
The Home Valuation Report is an in-depth analysis detailing your home's value as well as a comparison with similar homes in the area
Home Values in the Area
Average Home Value in this Area
Purchase History
| Date | Buyer | Sale Price | Title Company |
|---|---|---|---|
| Carlson Alyssa R | $65,000 | None Available | |
| Dalton Julie A | $74,000 | None Available | |
| Wensel Jason R | -- | None Available |
Source: Public Records
Mortgage History
| Date | Status | Borrower | Loan Amount |
|---|---|---|---|
| Open | Carlson Alyssa R | $61,750 | |
| Previous Owner | Dalton Julie A | $64,000 | |
| Previous Owner | Wensel Jason R | $40,500 |
Source: Public Records
Tax History Compared to Growth
Tax History
| Year | Tax Paid | Tax Assessment Tax Assessment Total Assessment is a certain percentage of the fair market value that is determined by local assessors to be the total taxable value of land and additions on the property. | Land | Improvement |
|---|---|---|---|---|
| 2025 | $2,416 | $57,220 | $5,850 | $51,370 |
| 2024 | $2,316 | $57,220 | $5,850 | $51,370 |
| 2023 | $2,316 | $57,220 | $5,850 | $51,370 |
| 2022 | $2,316 | $57,220 | $5,850 | $51,370 |
| 2021 | $2,316 | $57,220 | $5,850 | $51,370 |
| 2020 | $2,316 | $57,220 | $5,850 | $51,370 |
| 2019 | $2,258 | $57,220 | $5,850 | $51,370 |
| 2018 | $22 | $57,220 | $5,850 | $51,370 |
| 2017 | -- | $57,220 | $5,850 | $51,370 |
| 2016 | $2,085 | $57,220 | $5,850 | $51,370 |
| 2015 | $824 | $57,220 | $5,850 | $51,370 |
| 2014 | $824 | $45,450 | $5,850 | $39,600 |
Source: Public Records
Map
Nearby Homes
- 202 Birch St
- 415 W Hemlock Ave
- 222 Chestnut St
- 80 Greeves St
- 22 Hemlock Ave
- 136 N Fraley St
- 517 Park Ave
- 8 S Edgar St
- 124 Bayard St
- 194 N Fraley St
- 103 Pine Ave
- 536 Park Ave
- 418 Chase St
- 305 Janeway St
- 1076 Jo Rd
- 516 Hacker St
- 115 Lincoln St
- 384 Flickerwood Rd
- 303 Flickerwood Rd
- 201 Township Line Rd
- 33 N Tionesta Ave
- 27 N Tionesta Ave
- 35 N Tionesta Ave
- 23 N Tionesta Ave
- 26 N Tionesta Ave
- 30 N Tionesta Ave
- 24 N Tionesta Ave
- 37 N Tionesta Ave
- 32 N Tionesta Ave
- 21 N Tionesta Ave
- 22 N Tionesta Ave
- 20 N Tionesta Ave
- 19 N Tionesta Ave
- 217 Ash St
- 117 1/2 Ash St
- 18 N Tionesta Ave
- 117 Ash St
- 117 Ash St Unit 12
- 16 N Tionesta Ave
- 100 N Tionesta Ave