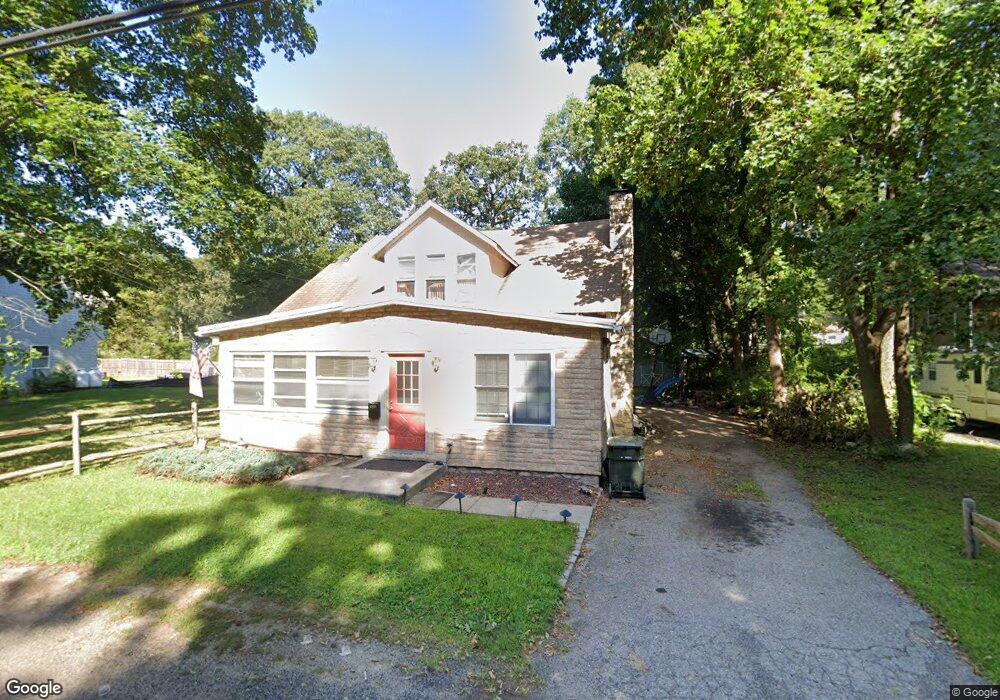
31 Netcong Rd Budd Lake, NJ 07828
Estimated Value: $414,142 - $523,000
--
Bed
--
Bath
1,529
Sq Ft
$297/Sq Ft
Est. Value
About This Home
This home is located at 31 Netcong Rd, Budd Lake, NJ 07828 and is currently estimated at $454,536, approximately $297 per square foot. 31 Netcong Rd is a home located in Morris County with nearby schools including Mt Olive Middle School and Mount Olive High School.
Ownership History
Date
Name
Owned For
Owner Type
Purchase Details
Closed on
Sep 8, 2006
Sold by
Antonucci Louis
Bought by
Vera Carlos
Current Estimated Value
Home Financials for this Owner
Home Financials are based on the most recent Mortgage that was taken out on this home.
Original Mortgage
$61,000
Outstanding Balance
$36,373
Interest Rate
6.54%
Mortgage Type
Stand Alone Second
Estimated Equity
$418,163
Create a Home Valuation Report for This Property
The Home Valuation Report is an in-depth analysis detailing your home's value as well as a comparison with similar homes in the area
Home Values in the Area
Average Home Value in this Area
Purchase History
| Date | Buyer | Sale Price | Title Company |
|---|---|---|---|
| Vera Carlos | $305,000 | -- |
Source: Public Records
Mortgage History
| Date | Status | Borrower | Loan Amount |
|---|---|---|---|
| Open | Vera Carlos | $61,000 |
Source: Public Records
Tax History Compared to Growth
Tax History
| Year | Tax Paid | Tax Assessment Tax Assessment Total Assessment is a certain percentage of the fair market value that is determined by local assessors to be the total taxable value of land and additions on the property. | Land | Improvement |
|---|---|---|---|---|
| 2025 | $6,688 | $191,900 | $100,600 | $91,300 |
| 2024 | $6,308 | $191,900 | $100,600 | $91,300 |
| 2023 | $6,308 | $191,900 | $100,600 | $91,300 |
| 2022 | $6,444 | $191,900 | $100,600 | $91,300 |
| 2021 | $6,444 | $191,900 | $100,600 | $91,300 |
| 2020 | $6,358 | $191,900 | $100,600 | $91,300 |
| 2019 | $6,337 | $191,900 | $100,600 | $91,300 |
| 2018 | $6,275 | $191,900 | $100,600 | $91,300 |
| 2017 | $6,166 | $191,900 | $100,600 | $91,300 |
| 2016 | $5,970 | $191,900 | $100,600 | $91,300 |
| 2015 | $6,110 | $191,900 | $100,600 | $91,300 |
| 2014 | $6,116 | $191,900 | $100,600 | $91,300 |
Source: Public Records
Map
Nearby Homes