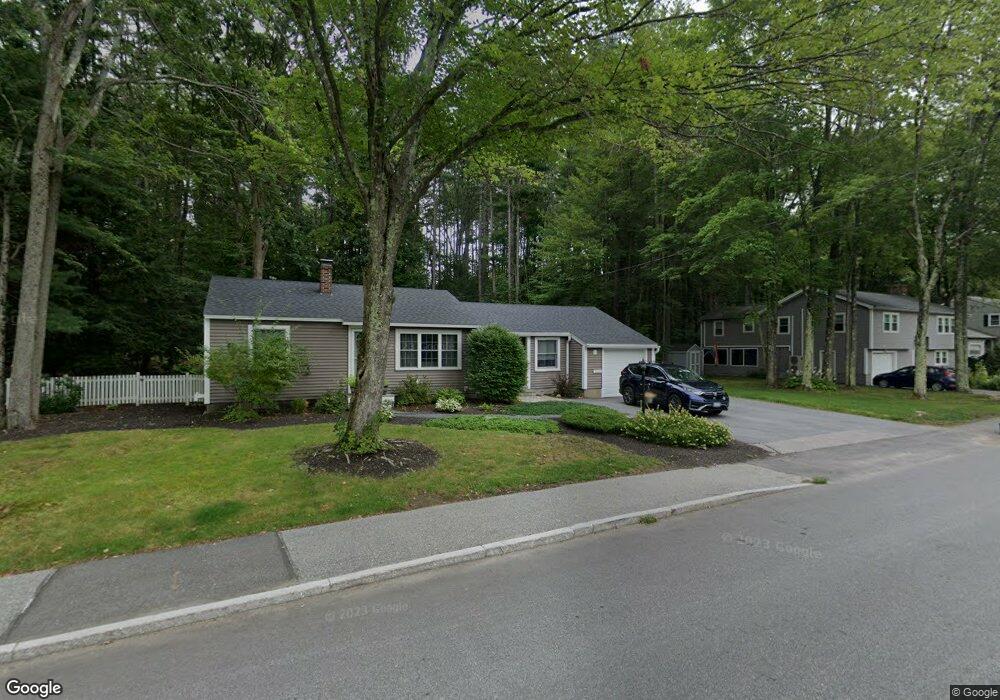
31 Norwich St Concord, NH 03301
South End NeighborhoodEstimated Value: $394,714 - $460,000
2
Beds
1
Bath
1,110
Sq Ft
$390/Sq Ft
Est. Value
About This Home
This home is located at 31 Norwich St, Concord, NH 03301 and is currently estimated at $433,179, approximately $390 per square foot. 31 Norwich St is a home located in Merrimack County with nearby schools including Abbot-Downing School, Rundlett Middle School, and Concord High School.
Ownership History
Date
Name
Owned For
Owner Type
Purchase Details
Closed on
Jun 10, 2020
Sold by
Knight Walter A
Bought by
Knight Ft and Knight
Current Estimated Value
Purchase Details
Closed on
Sep 7, 2004
Sold by
Merrill Lawrence G and Merrill Ellena T
Bought by
Knight Walter A
Home Financials for this Owner
Home Financials are based on the most recent Mortgage that was taken out on this home.
Original Mortgage
$156,000
Interest Rate
6.01%
Mortgage Type
Purchase Money Mortgage
Create a Home Valuation Report for This Property
The Home Valuation Report is an in-depth analysis detailing your home's value as well as a comparison with similar homes in the area
Home Values in the Area
Average Home Value in this Area
Purchase History
| Date | Buyer | Sale Price | Title Company |
|---|---|---|---|
| Knight Ft | -- | None Available | |
| Knight Walter A | $195,000 | -- |
Source: Public Records
Mortgage History
| Date | Status | Borrower | Loan Amount |
|---|---|---|---|
| Previous Owner | Knight Walter A | $182,318 | |
| Previous Owner | Knight Walter A | $196,969 | |
| Previous Owner | Knight Walter A | $156,000 |
Source: Public Records
Tax History Compared to Growth
Tax History
| Year | Tax Paid | Tax Assessment Tax Assessment Total Assessment is a certain percentage of the fair market value that is determined by local assessors to be the total taxable value of land and additions on the property. | Land | Improvement |
|---|---|---|---|---|
| 2024 | $7,465 | $269,600 | $122,700 | $146,900 |
| 2023 | $7,241 | $269,600 | $122,700 | $146,900 |
| 2022 | $6,980 | $269,600 | $122,700 | $146,900 |
| 2021 | $6,735 | $268,100 | $122,700 | $145,400 |
| 2020 | $6,176 | $230,800 | $96,500 | $134,300 |
| 2019 | $5,903 | $212,500 | $100,300 | $112,200 |
| 2018 | $5,911 | $209,700 | $100,700 | $109,000 |
| 2017 | $5,738 | $203,200 | $100,700 | $102,500 |
| 2016 | $5,423 | $196,000 | $98,800 | $97,200 |
| 2015 | $5,167 | $189,700 | $107,200 | $82,500 |
| 2014 | $5,086 | $189,700 | $107,200 | $82,500 |
| 2013 | -- | $187,400 | $107,200 | $80,200 |
| 2012 | -- | $187,500 | $112,900 | $74,600 |
Source: Public Records
Map
Nearby Homes
- 22 Wilson Ave
- 15 Wilson Ave
- 0 South St Unit 4969509
- 122 South St
- 12 Avon St
- 105 S Main St
- 289 South St
- 0 Spruce St Unit 88
- 33 Spruce St
- 376 S Main St
- 24 Pierce St
- 47 South St
- 2 Kensington Rd
- 1 Kensington Rd
- 14 Downing St
- 53 Heather Ln
- 14-16 Perley St
- 10 Perley St
- 87 S Main St Unit 2
- 54 Pleasant St Unit 8