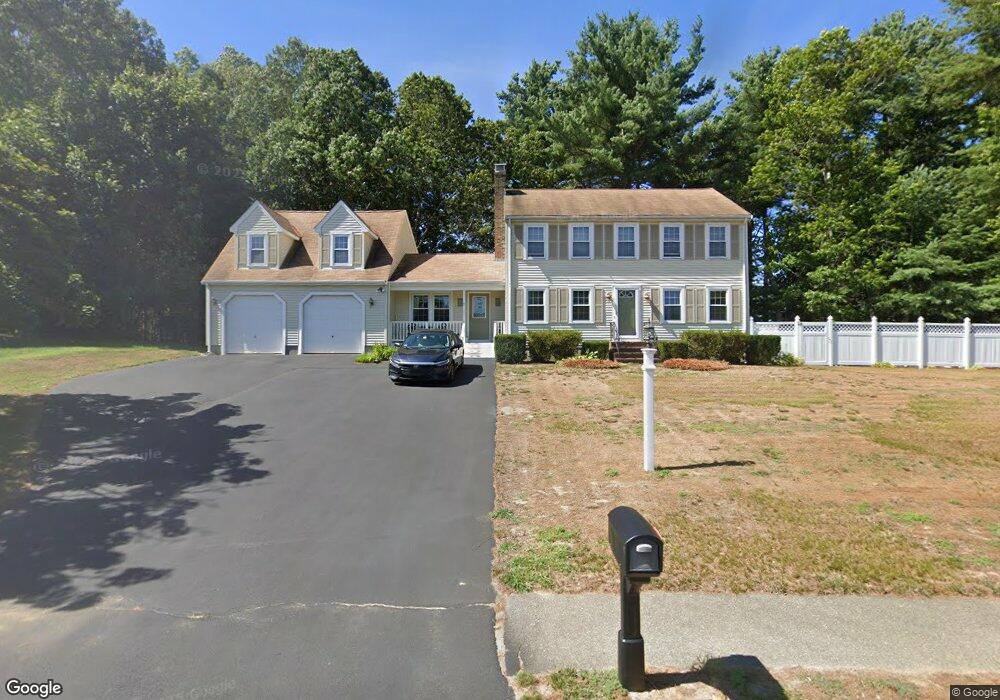
31 Oletree Rd Pembroke, MA 02359
Estimated Value: $679,000 - $848,000
3
Beds
2
Baths
2,301
Sq Ft
$329/Sq Ft
Est. Value
About This Home
This home is located at 31 Oletree Rd, Pembroke, MA 02359 and is currently estimated at $756,183, approximately $328 per square foot. 31 Oletree Rd is a home located in Plymouth County with nearby schools including Pembroke High School.
Ownership History
Date
Name
Owned For
Owner Type
Purchase Details
Closed on
Nov 13, 1992
Sold by
Shiavone & Sons Constr
Bought by
Wong Kenneth A and Wong Helen S
Current Estimated Value
Home Financials for this Owner
Home Financials are based on the most recent Mortgage that was taken out on this home.
Original Mortgage
$120,000
Interest Rate
7.88%
Mortgage Type
Purchase Money Mortgage
Create a Home Valuation Report for This Property
The Home Valuation Report is an in-depth analysis detailing your home's value as well as a comparison with similar homes in the area
Home Values in the Area
Average Home Value in this Area
Purchase History
| Date | Buyer | Sale Price | Title Company |
|---|---|---|---|
| Wong Kenneth A | $161,500 | -- |
Source: Public Records
Mortgage History
| Date | Status | Borrower | Loan Amount |
|---|---|---|---|
| Open | Wong Kenneth A | $316,400 | |
| Closed | Wong Kenneth A | $98,000 | |
| Closed | Wong Kenneth A | $120,000 |
Source: Public Records
Tax History Compared to Growth
Tax History
| Year | Tax Paid | Tax Assessment Tax Assessment Total Assessment is a certain percentage of the fair market value that is determined by local assessors to be the total taxable value of land and additions on the property. | Land | Improvement |
|---|---|---|---|---|
| 2025 | $7,967 | $662,800 | $305,300 | $357,500 |
| 2024 | $7,903 | $656,900 | $300,100 | $356,800 |
| 2023 | $7,549 | $593,500 | $285,300 | $308,200 |
| 2022 | $6,825 | $482,300 | $235,300 | $247,000 |
| 2021 | $6,679 | $458,100 | $220,100 | $238,000 |
| 2020 | $6,502 | $448,700 | $215,300 | $233,400 |
| 2019 | $6,332 | $433,700 | $210,100 | $223,600 |
| 2018 | $6,275 | $421,400 | $210,100 | $211,300 |
| 2017 | $6,188 | $409,800 | $200,100 | $209,700 |
| 2016 | $6,046 | $396,200 | $185,300 | $210,900 |
| 2015 | $5,709 | $387,300 | $175,300 | $212,000 |
Source: Public Records
Map
Nearby Homes