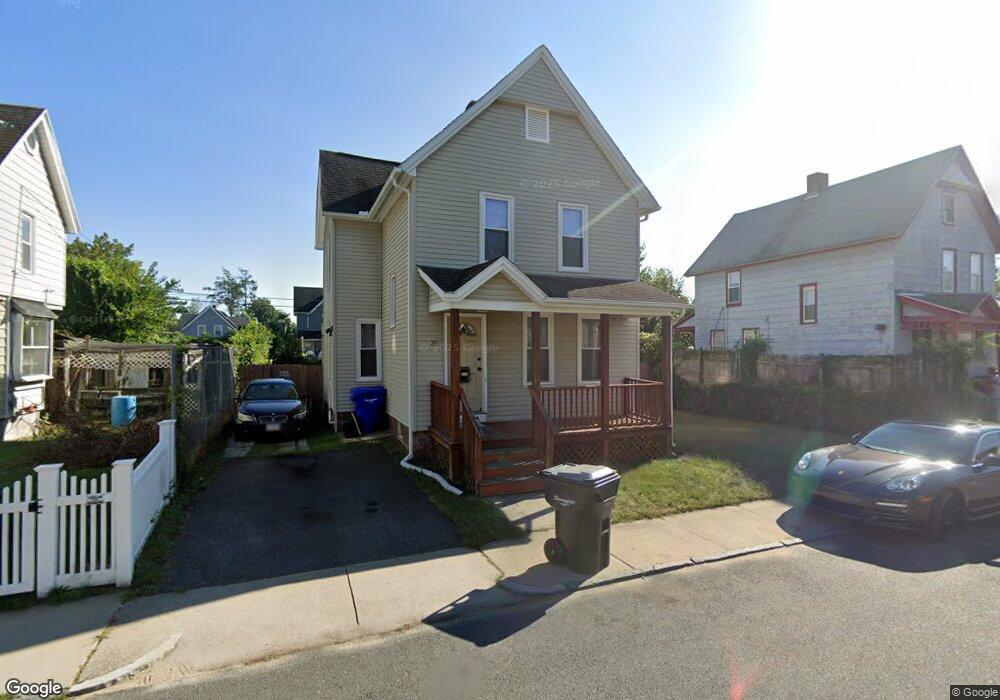
31 Olive St Springfield, MA 01109
Old Hill NeighborhoodEstimated Value: $239,000 - $274,000
3
Beds
1
Bath
1,253
Sq Ft
$204/Sq Ft
Est. Value
About This Home
This home is located at 31 Olive St, Springfield, MA 01109 and is currently estimated at $255,992, approximately $204 per square foot. 31 Olive St is a home located in Hampden County with nearby schools including Mary A. Dryden Veterans Memorial School, M Marcus Kiley Middle, and High School Of Commerce.
Ownership History
Date
Name
Owned For
Owner Type
Purchase Details
Closed on
Apr 22, 2004
Sold by
Ridubois Peter A
Bought by
Ramos Ada Z and Ramos David
Current Estimated Value
Home Financials for this Owner
Home Financials are based on the most recent Mortgage that was taken out on this home.
Original Mortgage
$91,563
Interest Rate
5.4%
Mortgage Type
Purchase Money Mortgage
Purchase Details
Closed on
Mar 23, 2001
Sold by
Woodfine Frank L
Bought by
Ridubois Peter A
Home Financials for this Owner
Home Financials are based on the most recent Mortgage that was taken out on this home.
Original Mortgage
$65,964
Interest Rate
6.93%
Mortgage Type
Purchase Money Mortgage
Purchase Details
Closed on
Dec 27, 1999
Sold by
Springfield City Of
Bought by
Woodfine Frank L
Create a Home Valuation Report for This Property
The Home Valuation Report is an in-depth analysis detailing your home's value as well as a comparison with similar homes in the area
Home Values in the Area
Average Home Value in this Area
Purchase History
| Date | Buyer | Sale Price | Title Company |
|---|---|---|---|
| Ramos Ada Z | $93,000 | -- | |
| Ridubois Peter A | $67,000 | -- | |
| Woodfine Frank L | $2,000 | -- |
Source: Public Records
Mortgage History
| Date | Status | Borrower | Loan Amount |
|---|---|---|---|
| Open | Woodfine Frank L | $87,466 | |
| Closed | Ramos Ada Z | $91,563 | |
| Previous Owner | Woodfine Frank L | $65,964 |
Source: Public Records
Tax History
| Year | Tax Paid | Tax Assessment Tax Assessment Total Assessment is a certain percentage of the fair market value that is determined by local assessors to be the total taxable value of land and additions on the property. | Land | Improvement |
|---|---|---|---|---|
| 2025 | $3,089 | $197,000 | $24,100 | $172,900 |
| 2024 | $2,406 | $149,800 | $22,500 | $127,300 |
| 2023 | $2,368 | $138,900 | $21,500 | $117,400 |
| 2022 | $2,554 | $135,700 | $19,500 | $116,200 |
| 2021 | $2,502 | $132,400 | $17,800 | $114,600 |
| 2020 | $2,480 | $127,000 | $17,800 | $109,200 |
| 2019 | $2,342 | $119,000 | $17,800 | $101,200 |
| 2018 | $2,041 | $103,700 | $17,800 | $85,900 |
| 2017 | $2,170 | $110,400 | $14,200 | $96,200 |
| 2016 | $2,076 | $105,600 | $14,200 | $91,400 |
| 2015 | $1,987 | $101,000 | $14,200 | $86,800 |
Source: Public Records
Map
Nearby Homes
- 41 Olive St
- 86 Alden St
- 189 Northampton Ave
- 70-72 Manhattan St
- 21 Westford Cir
- 349 Walnut St
- 290 Quincy St
- 0 NS (24) Alden St
- 124-126 Westford Cir
- 0 Allen St (Ss)
- 20 Hawthorne St
- 118 Quincy St
- 19 Westford Ave
- 15 Malden St
- 89 Cedar St
- 42 Florence St
- 135-137 Suffolk St
- 55 Malden St
- 22-24 Westminster St
- 19 Quincy St
Your Personal Tour Guide
Ask me questions while you tour the home.