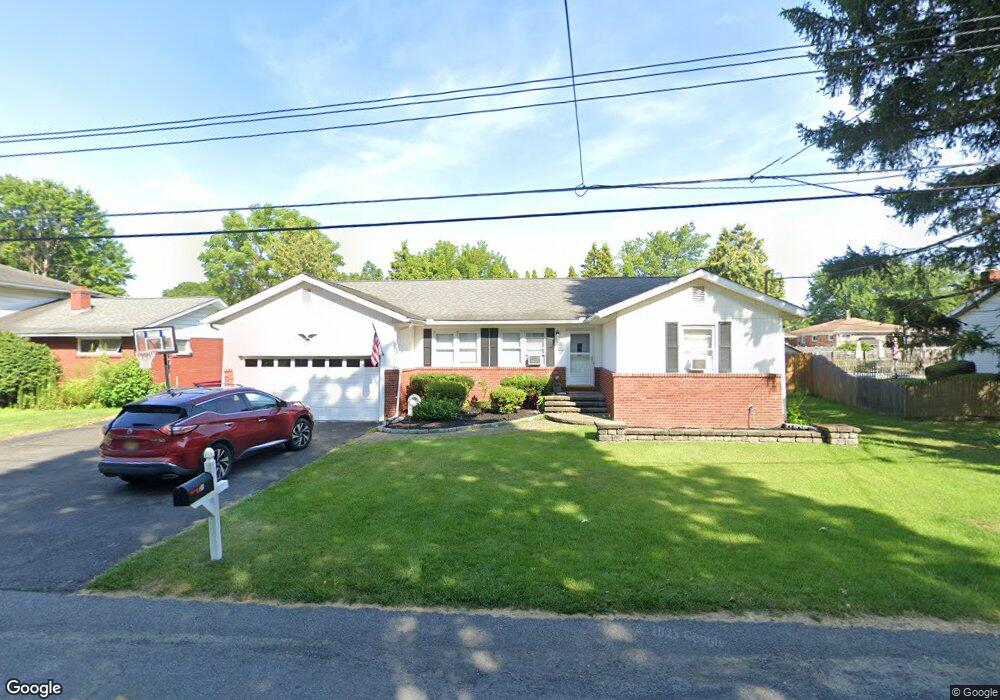
31 Oliver Ave Albany, NY 12203
Campus Area NeighborhoodEstimated Value: $322,000 - $441,000
3
Beds
2
Baths
1,767
Sq Ft
$224/Sq Ft
Est. Value
About This Home
This home is located at 31 Oliver Ave, Albany, NY 12203 and is currently estimated at $396,215, approximately $224 per square foot. 31 Oliver Ave is a home located in Albany County with nearby schools including Eagle Point Elementary School, William S Hackett Middle School, and Albany High School.
Ownership History
Date
Name
Owned For
Owner Type
Purchase Details
Closed on
Oct 23, 2023
Sold by
Volmer Anne M
Bought by
Volmer Jeremy E
Current Estimated Value
Purchase Details
Closed on
Dec 9, 2010
Sold by
Volmer Jeremy E and Rinaldo Volmer Ann
Bought by
Volmer Jeremy E
Purchase Details
Closed on
Jun 4, 2010
Sold by
Rinaldo Joseph J
Bought by
Volmer Jeremy E and Rinaldo Volmer Ann
Home Financials for this Owner
Home Financials are based on the most recent Mortgage that was taken out on this home.
Original Mortgage
$93,712
Interest Rate
4.5%
Mortgage Type
FHA
Create a Home Valuation Report for This Property
The Home Valuation Report is an in-depth analysis detailing your home's value as well as a comparison with similar homes in the area
Home Values in the Area
Average Home Value in this Area
Purchase History
| Date | Buyer | Sale Price | Title Company |
|---|---|---|---|
| Volmer Jeremy E | -- | None Listed On Document | |
| Volmer Jeremy E | -- | None Available | |
| Volmer Jeremy E | $95,000 | Chicago Title Insurance Co |
Source: Public Records
Mortgage History
| Date | Status | Borrower | Loan Amount |
|---|---|---|---|
| Previous Owner | Volmer Jeremy E | $93,712 |
Source: Public Records
Tax History Compared to Growth
Tax History
| Year | Tax Paid | Tax Assessment Tax Assessment Total Assessment is a certain percentage of the fair market value that is determined by local assessors to be the total taxable value of land and additions on the property. | Land | Improvement |
|---|---|---|---|---|
| 2024 | $10,159 | $366,000 | $73,200 | $292,800 |
| 2023 | $8,458 | $223,000 | $45,000 | $178,000 |
| 2022 | $8,685 | $223,000 | $45,000 | $178,000 |
| 2021 | $8,050 | $223,000 | $45,000 | $178,000 |
| 2020 | $8,185 | $223,000 | $45,000 | $178,000 |
| 2019 | $8,780 | $223,000 | $45,000 | $178,000 |
| 2018 | $8,208 | $223,000 | $45,000 | $178,000 |
| 2017 | $3,237 | $223,000 | $45,000 | $178,000 |
| 2016 | $7,601 | $223,000 | $45,000 | $178,000 |
| 2015 | $7,062 | $210,000 | $43,700 | $166,300 |
| 2014 | -- | $210,000 | $43,700 | $166,300 |
Source: Public Records
Map
Nearby Homes