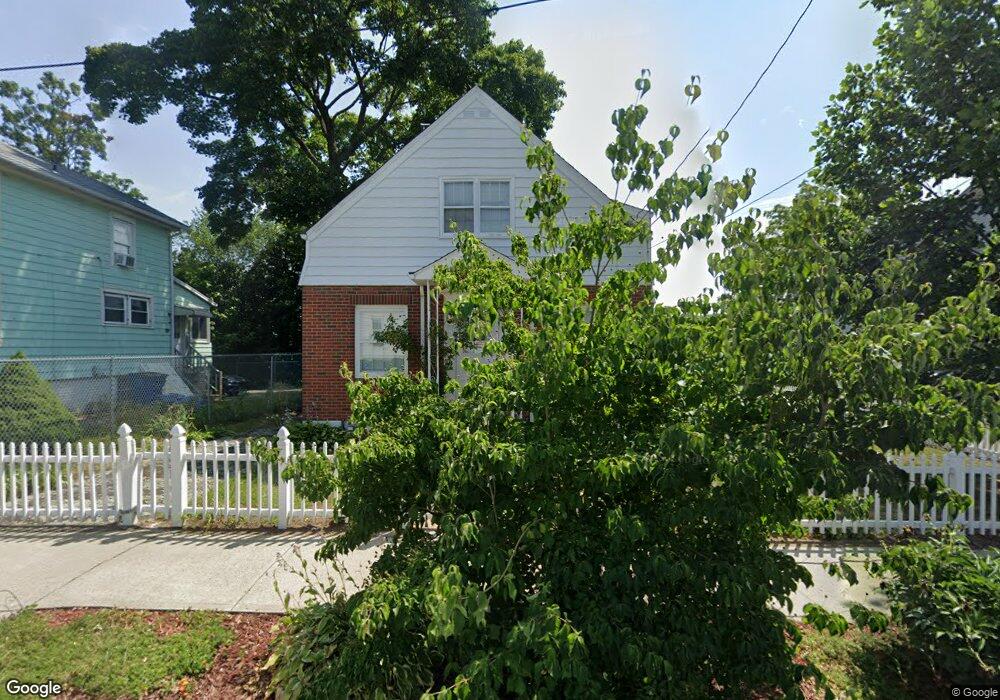
31 Perkins St New Haven, CT 06513
Fair Haven NeighborhoodEstimated Value: $299,000 - $382,000
2
Beds
2
Baths
1,751
Sq Ft
$202/Sq Ft
Est. Value
About This Home
This home is located at 31 Perkins St, New Haven, CT 06513 and is currently estimated at $353,744, approximately $202 per square foot. 31 Perkins St is a home located in New Haven County with nearby schools including Fair Haven School, Elm City College Preparatory School, and St Francis & St Rose Of Lima School.
Ownership History
Date
Name
Owned For
Owner Type
Purchase Details
Closed on
Sep 10, 2015
Sold by
Carter Lilly B
Bought by
Carter Lilly B and Carter Angela
Current Estimated Value
Purchase Details
Closed on
Sep 21, 1994
Sold by
Lostritto Carmel Est
Bought by
Carter Lilly B
Home Financials for this Owner
Home Financials are based on the most recent Mortgage that was taken out on this home.
Original Mortgage
$82,800
Interest Rate
8.56%
Mortgage Type
Unknown
Create a Home Valuation Report for This Property
The Home Valuation Report is an in-depth analysis detailing your home's value as well as a comparison with similar homes in the area
Home Values in the Area
Average Home Value in this Area
Purchase History
| Date | Buyer | Sale Price | Title Company |
|---|---|---|---|
| Carter Lilly B | -- | -- | |
| Carter Lilly B | $85,000 | -- |
Source: Public Records
Mortgage History
| Date | Status | Borrower | Loan Amount |
|---|---|---|---|
| Previous Owner | Carter Lilly B | $82,800 |
Source: Public Records
Tax History Compared to Growth
Tax History
| Year | Tax Paid | Tax Assessment Tax Assessment Total Assessment is a certain percentage of the fair market value that is determined by local assessors to be the total taxable value of land and additions on the property. | Land | Improvement |
|---|---|---|---|---|
| 2025 | $7,270 | $184,520 | $48,160 | $136,360 |
| 2024 | $7,104 | $184,520 | $48,160 | $136,360 |
| 2023 | $6,864 | $184,520 | $48,160 | $136,360 |
| 2022 | $7,335 | $184,520 | $48,160 | $136,360 |
| 2021 | $5,716 | $130,270 | $33,950 | $96,320 |
| 2020 | $5,716 | $130,270 | $33,950 | $96,320 |
| 2019 | $5,599 | $130,270 | $33,950 | $96,320 |
| 2018 | $5,599 | $130,270 | $33,950 | $96,320 |
| 2017 | $5,039 | $130,270 | $33,950 | $96,320 |
| 2016 | $4,985 | $119,980 | $29,260 | $90,720 |
| 2015 | $4,985 | $119,980 | $29,260 | $90,720 |
| 2014 | $4,985 | $119,980 | $29,260 | $90,720 |
Source: Public Records
Map
Nearby Homes
- 25 Pine St
- 100 Front St Unit 100
- 674 Quinnipiac Ave
- 118 Grafton St
- 728 Quinnipiac Ave
- 71 Houston St
- 314 Lenox St
- 72 Pierpont St
- 85 Pierpont St
- 54 Lombard St
- 181 Lombard St
- 147 Lombard St
- 8 Front St Unit D
- 308 Poplar St
- 43 E Pearl St
- 32 E Pearl St
- 409 Poplar St
- 533 Quinnipiac Ave
- 191 Ferry St
- 33 Chapel St