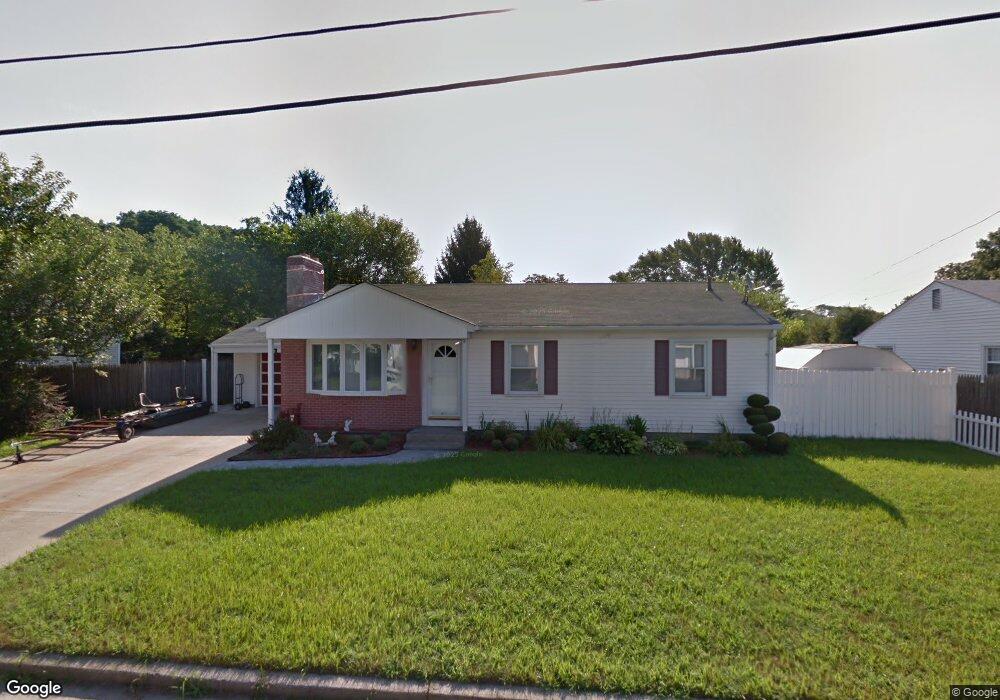
31 Plum Rd Riverside, RI 02915
Riverside NeighborhoodEstimated Value: $446,000 - $482,000
3
Beds
2
Baths
1,975
Sq Ft
$236/Sq Ft
Est. Value
About This Home
This home is located at 31 Plum Rd, Riverside, RI 02915 and is currently estimated at $465,713, approximately $235 per square foot. 31 Plum Rd is a home located in Providence County with nearby schools including East Providence High School, St Luke Elementary School, and St Mary Academy-Bay View.
Ownership History
Date
Name
Owned For
Owner Type
Purchase Details
Closed on
Nov 13, 2012
Sold by
Medeiros Antonio E and Medeiros Maria A
Bought by
Medeiros Irt
Current Estimated Value
Purchase Details
Closed on
Aug 31, 1992
Sold by
Heywood Dorothy L
Bought by
Medeiros Antonio E and Medeiros Maria
Home Financials for this Owner
Home Financials are based on the most recent Mortgage that was taken out on this home.
Original Mortgage
$60,000
Interest Rate
8.09%
Create a Home Valuation Report for This Property
The Home Valuation Report is an in-depth analysis detailing your home's value as well as a comparison with similar homes in the area
Home Values in the Area
Average Home Value in this Area
Purchase History
| Date | Buyer | Sale Price | Title Company |
|---|---|---|---|
| Medeiros Irt | -- | -- | |
| Medeiros Antonio E | $126,500 | -- |
Source: Public Records
Mortgage History
| Date | Status | Borrower | Loan Amount |
|---|---|---|---|
| Previous Owner | Medeiros Antonio E | $60,000 |
Source: Public Records
Tax History Compared to Growth
Tax History
| Year | Tax Paid | Tax Assessment Tax Assessment Total Assessment is a certain percentage of the fair market value that is determined by local assessors to be the total taxable value of land and additions on the property. | Land | Improvement |
|---|---|---|---|---|
| 2025 | $5,994 | $458,600 | $127,100 | $331,500 |
| 2024 | $5,683 | $370,700 | $105,900 | $264,800 |
| 2023 | $5,472 | $370,700 | $105,900 | $264,800 |
| 2022 | $5,187 | $237,300 | $59,600 | $177,700 |
| 2021 | $5,102 | $237,300 | $57,000 | $180,300 |
| 2020 | $4,886 | $237,300 | $57,000 | $180,300 |
| 2019 | $4,751 | $237,300 | $57,000 | $180,300 |
| 2018 | $5,141 | $224,700 | $55,400 | $169,300 |
| 2017 | $5,027 | $224,700 | $55,400 | $169,300 |
| 2016 | $5,002 | $224,700 | $55,400 | $169,300 |
| 2015 | $4,719 | $205,600 | $51,300 | $154,300 |
| 2014 | $4,719 | $205,600 | $51,300 | $154,300 |
Source: Public Records
Map
Nearby Homes
- 36 Woodbine St
- 74 Plum Rd
- 25 Woodbine St
- 536 Willett Ave
- 25 Winslow St
- 25 Read St
- 57 Harris St
- 735 Willett Ave Unit 806
- 25 Arnold St
- 146 Becker Ave
- 81 Sprague Ave
- 151 Willett Ave Unit 2
- 151 Willett Ave Unit 5
- 46 Tanglewood Dr
- 6 Hilton Ave
- 81 Pine Crest Dr
- 83 Pine Crest Dr
- 1 Fales St
- 85 Hilton Ave
- 17 Oak Ave