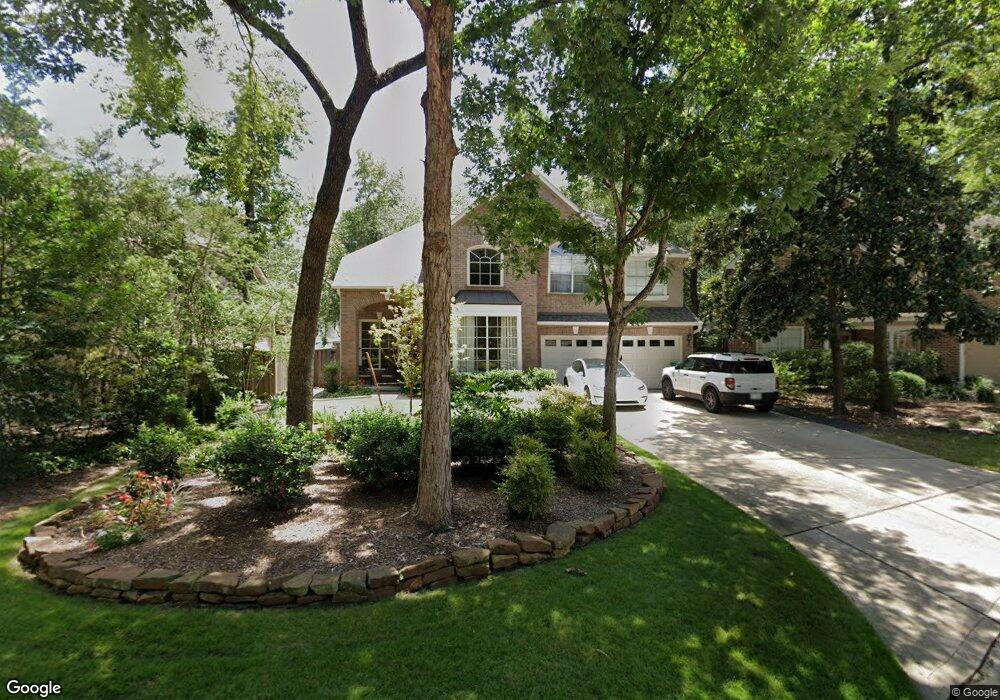
31 Redland Place Spring, TX 77382
Alden Bridge NeighborhoodEstimated Value: $589,000 - $627,000
4
Beds
3
Baths
2,777
Sq Ft
$216/Sq Ft
Est. Value
About This Home
This home is located at 31 Redland Place, Spring, TX 77382 and is currently estimated at $599,995, approximately $216 per square foot. 31 Redland Place is a home located in Montgomery County with nearby schools including Buckalew Elementary School, Mitchell Intermediate School, and McCullough Junior High School.
Ownership History
Date
Name
Owned For
Owner Type
Purchase Details
Closed on
Jun 1, 2010
Sold by
Gregg Russell and Gregg Marla
Bought by
Dalessandro Michael and Dalessandro Heather B
Current Estimated Value
Home Financials for this Owner
Home Financials are based on the most recent Mortgage that was taken out on this home.
Original Mortgage
$233,200
Outstanding Balance
$155,984
Interest Rate
4.93%
Mortgage Type
New Conventional
Estimated Equity
$444,011
Purchase Details
Closed on
Dec 22, 2006
Sold by
Federal Home Loan Mortgage Corp
Bought by
Dalessandro Michael V and Dalessandro Heather B
Home Financials for this Owner
Home Financials are based on the most recent Mortgage that was taken out on this home.
Original Mortgage
$43,100
Interest Rate
6.2%
Mortgage Type
Stand Alone Second
Purchase Details
Closed on
Jun 23, 1998
Sold by
Life Forms Inc
Bought by
Horn Robert J
Home Financials for this Owner
Home Financials are based on the most recent Mortgage that was taken out on this home.
Original Mortgage
$189,500
Interest Rate
7.13%
Create a Home Valuation Report for This Property
The Home Valuation Report is an in-depth analysis detailing your home's value as well as a comparison with similar homes in the area
Home Values in the Area
Average Home Value in this Area
Purchase History
| Date | Buyer | Sale Price | Title Company |
|---|---|---|---|
| Dalessandro Michael | -- | Charter Title Company | |
| Dalessandro Michael V | -- | -- | |
| Gregg Russell | -- | Old Republic Title | |
| Horn Robert J | -- | American Title Company |
Source: Public Records
Mortgage History
| Date | Status | Borrower | Loan Amount |
|---|---|---|---|
| Open | Dalessandro Michael | $233,200 | |
| Previous Owner | Gregg Russell | $43,100 | |
| Previous Owner | Gregg Russell | $230,000 | |
| Previous Owner | Dalessandro Michael V | $43,100 | |
| Previous Owner | Horn Robert J | $189,500 |
Source: Public Records
Tax History
| Year | Tax Paid | Tax Assessment Tax Assessment Total Assessment is a certain percentage of the fair market value that is determined by local assessors to be the total taxable value of land and additions on the property. | Land | Improvement |
|---|---|---|---|---|
| 2025 | $7,182 | $529,024 | -- | -- |
| 2024 | $7,182 | $480,931 | -- | -- |
| 2023 | $6,486 | $437,210 | $80,000 | $391,080 |
| 2022 | $8,056 | $397,460 | $80,000 | $378,870 |
| 2021 | $7,881 | $361,330 | $36,240 | $325,090 |
| 2020 | $8,443 | $365,000 | $36,240 | $328,760 |
| 2019 | $8,720 | $365,340 | $36,240 | $329,100 |
| 2018 | $7,266 | $340,070 | $36,240 | $303,830 |
| 2017 | $8,869 | $367,080 | $36,240 | $330,840 |
| 2016 | $8,869 | $367,080 | $36,240 | $330,840 |
| 2015 | $7,193 | $334,250 | $36,240 | $315,640 |
| 2014 | $7,193 | $303,860 | $36,240 | $282,490 |
Source: Public Records
Map
Nearby Homes
- 58 S Bethany Bend Cir
- 14 Redland Place
- 2 Sweet Birch Place
- 70 Harvest Wind Place
- 18 Teak Mill Place
- 30 Lyreleaf Place
- 147 Linton Downs Place
- 163 N Millport Cir
- 130 S Millport Cir
- 14 Willow Point Place
- 413 New Forest Ln
- 178 Brooksedge Ct
- 19 Clingstone Place
- 74 Blackstar Place
- 78 N Walden Elms Cir
- 14 Broadweather Place
- 7 Cross Lake Dr
- 150 S Walden Elms Cir
- 3 Belcarra Place
- 19 Timberstar St
- 27 Redland Place
- 35 Redland Place
- 50 S Bethany Bend Cir
- 23 Redland Place
- 46 S Bethany Bend Cir
- 39 Redland Place
- 42 S Bethany Bend Cir
- 19 Redland Place
- 30 Redland Place
- 42 Redland Place
- 62 S Bethany Bend Cir
- 26 Redland Place
- 34 Redland Place
- 38 Redland Place
- 66 S Bethany Bend Cir
- 22 Redland Place
- 38 S Bethany Bend Cir
- 70 S Bethany Bend Cir
- 18 Redland Place
- 74 S Bethany Bend Cir
Your Personal Tour Guide
Ask me questions while you tour the home.