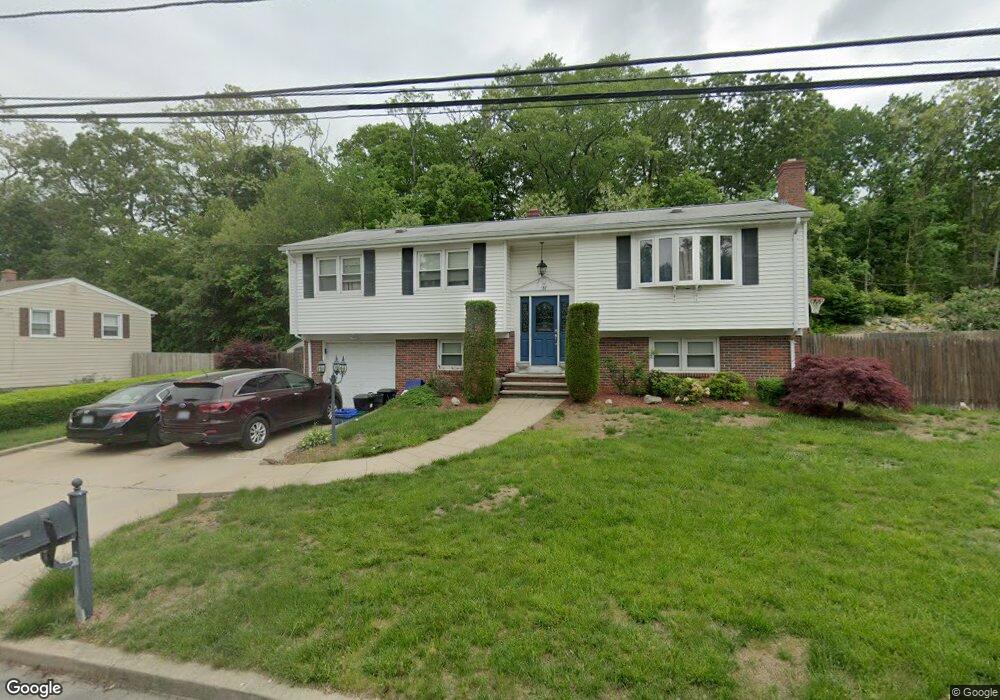
31 S Bennett Dr Johnston, RI 02919
Thornton NeighborhoodEstimated Value: $436,000 - $497,000
3
Beds
2
Baths
2,054
Sq Ft
$225/Sq Ft
Est. Value
About This Home
This home is located at 31 S Bennett Dr, Johnston, RI 02919 and is currently estimated at $462,517, approximately $225 per square foot. 31 S Bennett Dr is a home located in Providence County with nearby schools including Johnston Senior High School, Achievement First Promesa, and St Rocco School.
Ownership History
Date
Name
Owned For
Owner Type
Purchase Details
Closed on
Jan 28, 2010
Sold by
Defeo Gabriel N
Bought by
Ramirez Emily M and Ramirez Alexander
Current Estimated Value
Home Financials for this Owner
Home Financials are based on the most recent Mortgage that was taken out on this home.
Original Mortgage
$182,400
Outstanding Balance
$120,234
Interest Rate
4.95%
Mortgage Type
Purchase Money Mortgage
Estimated Equity
$342,283
Create a Home Valuation Report for This Property
The Home Valuation Report is an in-depth analysis detailing your home's value as well as a comparison with similar homes in the area
Home Values in the Area
Average Home Value in this Area
Purchase History
| Date | Buyer | Sale Price | Title Company |
|---|---|---|---|
| Ramirez Emily M | $228,000 | -- | |
| Ramirez Emily M | $228,000 | -- |
Source: Public Records
Mortgage History
| Date | Status | Borrower | Loan Amount |
|---|---|---|---|
| Open | Ramirez Emily M | $182,400 | |
| Closed | Ramirez Emily M | $182,400 |
Source: Public Records
Tax History
| Year | Tax Paid | Tax Assessment Tax Assessment Total Assessment is a certain percentage of the fair market value that is determined by local assessors to be the total taxable value of land and additions on the property. | Land | Improvement |
|---|---|---|---|---|
| 2025 | $5,673 | $363,200 | $89,600 | $273,600 |
| 2024 | $5,557 | $363,200 | $89,600 | $273,600 |
| 2023 | $5,557 | $363,200 | $89,600 | $273,600 |
| 2022 | $5,220 | $224,600 | $66,400 | $158,200 |
| 2021 | $5,220 | $224,600 | $66,400 | $158,200 |
| 2018 | $5,399 | $196,400 | $49,400 | $147,000 |
| 2016 | $7,143 | $196,400 | $49,400 | $147,000 |
| 2015 | $4,792 | $165,300 | $49,900 | $115,400 |
| 2014 | $4,752 | $165,300 | $49,900 | $115,400 |
| 2013 | $4,752 | $165,300 | $49,900 | $115,400 |
Source: Public Records
Map
Nearby Homes
Your Personal Tour Guide
Ask me questions while you tour the home.