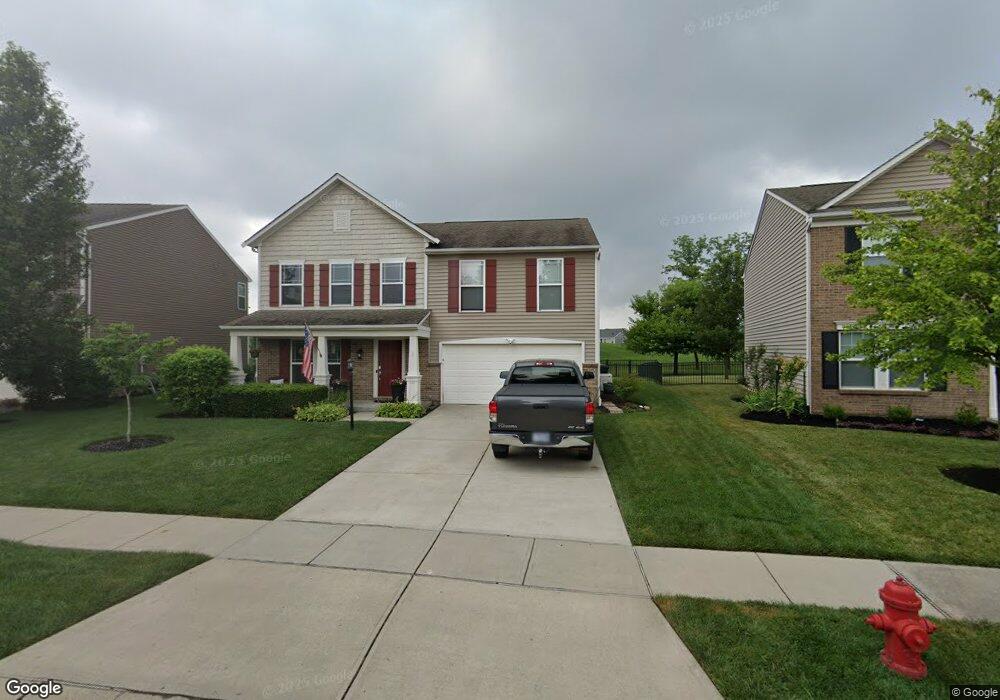
31 Shady Pines Ave Springboro, OH 45066
Clearcreek Township NeighborhoodEstimated Value: $423,859 - $446,000
4
Beds
3
Baths
2,420
Sq Ft
$181/Sq Ft
Est. Value
About This Home
This home is located at 31 Shady Pines Ave, Springboro, OH 45066 and is currently estimated at $438,715, approximately $181 per square foot. 31 Shady Pines Ave is a home located in Warren County with nearby schools including Clearcreek Elementary School, Springboro Intermediate School, and Springboro Junior High School.
Ownership History
Date
Name
Owned For
Owner Type
Purchase Details
Closed on
Aug 21, 2020
Sold by
Simsek Berk
Bought by
Bradley Daryl and Bradley Shaun
Current Estimated Value
Home Financials for this Owner
Home Financials are based on the most recent Mortgage that was taken out on this home.
Original Mortgage
$312,015
Outstanding Balance
$276,779
Interest Rate
3%
Mortgage Type
VA
Estimated Equity
$161,936
Purchase Details
Closed on
Nov 9, 2016
Sold by
Bingley Steven R and Bingley Katherine L
Bought by
Simsek Berk
Purchase Details
Closed on
Oct 19, 2015
Sold by
Corkern Christopher E and Corkern Jessica L
Bought by
Bingley Steven R and Bingley Katherine L
Purchase Details
Closed on
Sep 6, 2012
Sold by
Fischer Single Family Home Ii Llc
Bought by
Corkern Christopher E and Cormery Jessica L
Home Financials for this Owner
Home Financials are based on the most recent Mortgage that was taken out on this home.
Original Mortgage
$160,361
Interest Rate
3.56%
Mortgage Type
Future Advance Clause Open End Mortgage
Purchase Details
Closed on
Jun 25, 2012
Sold by
Fischer Development Co Ii Inc
Bought by
Fischer Single Family Homes Ii Llc
Create a Home Valuation Report for This Property
The Home Valuation Report is an in-depth analysis detailing your home's value as well as a comparison with similar homes in the area
Home Values in the Area
Average Home Value in this Area
Purchase History
| Date | Buyer | Sale Price | Title Company |
|---|---|---|---|
| Bradley Daryl | $305,000 | Chicago Title Company Llc | |
| Simsek Berk | $205,000 | Chicago Title | |
| Bingley Steven R | -- | Attorney | |
| Corkern Christopher E | $168,833 | None Available | |
| Fischer Single Family Homes Ii Llc | $149,166 | None Available |
Source: Public Records
Mortgage History
| Date | Status | Borrower | Loan Amount |
|---|---|---|---|
| Open | Bradley Daryl | $312,015 | |
| Previous Owner | Corkern Christopher E | $160,361 |
Source: Public Records
Tax History Compared to Growth
Tax History
| Year | Tax Paid | Tax Assessment Tax Assessment Total Assessment is a certain percentage of the fair market value that is determined by local assessors to be the total taxable value of land and additions on the property. | Land | Improvement |
|---|---|---|---|---|
| 2024 | $4,073 | $123,910 | $35,000 | $88,910 |
| 2023 | $3,926 | $92,204 | $16,520 | $75,684 |
| 2022 | $3,868 | $92,204 | $16,520 | $75,684 |
| 2021 | $3,600 | $92,204 | $16,520 | $75,684 |
| 2020 | $3,490 | $78,138 | $14,000 | $64,138 |
| 2019 | $3,218 | $78,138 | $14,000 | $64,138 |
| 2018 | $3,220 | $78,138 | $14,000 | $64,138 |
| 2017 | $2,993 | $65,408 | $13,461 | $51,947 |
| 2016 | $3,121 | $65,408 | $13,461 | $51,947 |
| 2015 | $3,128 | $65,408 | $13,461 | $51,947 |
| 2014 | $2,871 | $56,880 | $11,700 | $45,170 |
| 2013 | $2,868 | $68,030 | $14,000 | $54,030 |
Source: Public Records
Map
Nearby Homes
- 111 Rippling Brook Ln
- 165 Waterhaven Way
- 146 Rippling Brook Ln
- 285 Waterhaven Way
- 5 Old Pond Rd
- 44 Old Pond Rd
- 155 Clearsprings Dr
- 160 Old Pond Rd
- 163 Oasis Ct
- 108 Old Pond Rd
- 195 Oasis Ct
- 10109 Gully Pass Dr
- 65 Artesian Ct
- 10090 Gully Pass Dr
- 10084 Gully Pass Dr
- Nicholas Plan at Washington Glen - Classic Series
- Dillon Plan at Washington Glen - Classic Series
- Barrett Plan at Washington Glen - Classic Series
- Faulkner Plan at Washington Glen - Classic Series
- Dawson Plan at Washington Glen - Classic Series
- 31 Shady Pines Ave
- 35 Shady Pines Ave
- 35 Shady Pines Ave
- 27 Shady Pines Ave Unit 131
- 27 Shady Pines Ave
- 39 Shady Pines Ave
- 23 Shady Pines Ave
- 43 Shady Pines Ave
- 19 Shady Pines Ave
- 28 Shady Pines Ave
- 15 Shady Pines Ave
- 50 Shady Pines Ave Unit 118
- 50 Shady Pines Ave
- 34 Shady Pines Ave
- 51 Shady Pines Ave
- 46 Shady Pines Ave
- 11 Shady Pines Ave
- 16 Shady Pines Ave
- 150 Sweetgum Ln
- 55 Shady Pines Ave