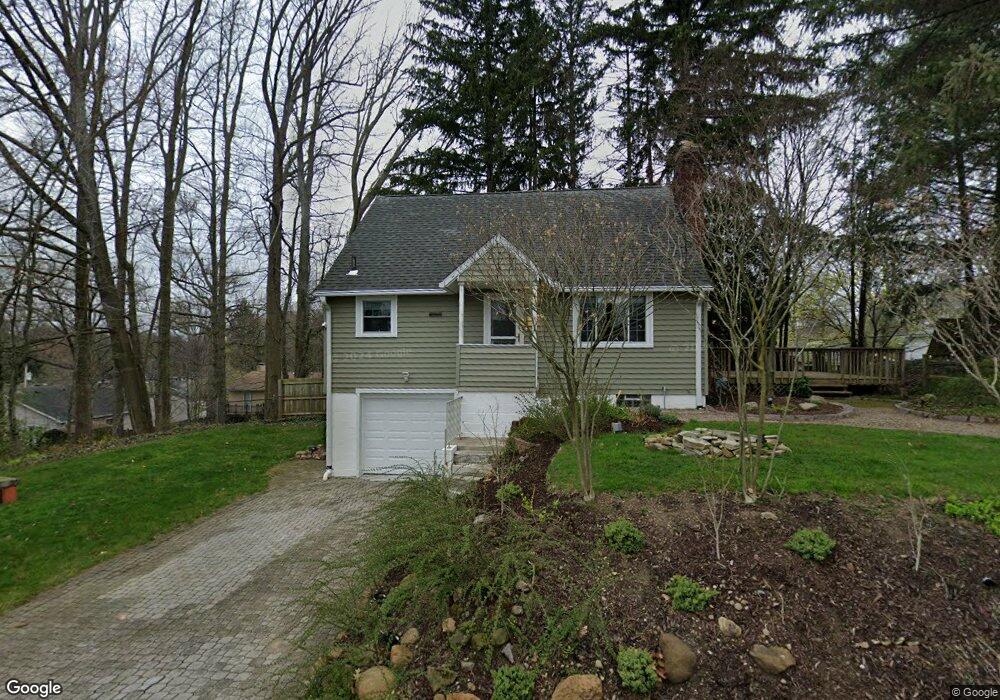
31 Siebanoller Ct Tallmadge, OH 44278
Estimated Value: $169,000 - $192,000
3
Beds
1
Bath
750
Sq Ft
$238/Sq Ft
Est. Value
About This Home
This home is located at 31 Siebanoller Ct, Tallmadge, OH 44278 and is currently estimated at $178,594, approximately $238 per square foot. 31 Siebanoller Ct is a home located in Summit County with nearby schools including Tallmadge Middle School, Tallmadge High School, and Middlebury Academy.
Ownership History
Date
Name
Owned For
Owner Type
Purchase Details
Closed on
Oct 17, 2022
Sold by
Advanced Opportunities Inc
Bought by
Corbett Shane
Current Estimated Value
Home Financials for this Owner
Home Financials are based on the most recent Mortgage that was taken out on this home.
Original Mortgage
$138,000
Outstanding Balance
$132,437
Interest Rate
5.66%
Mortgage Type
VA
Estimated Equity
$46,157
Purchase Details
Closed on
Jun 23, 2022
Sold by
Sheriff Of Summit County
Bought by
Advanced Opportunities Inc
Purchase Details
Closed on
Jul 31, 1998
Sold by
Baden Roger D
Bought by
Jones Errol
Home Financials for this Owner
Home Financials are based on the most recent Mortgage that was taken out on this home.
Original Mortgage
$80,000
Interest Rate
7.03%
Mortgage Type
New Conventional
Create a Home Valuation Report for This Property
The Home Valuation Report is an in-depth analysis detailing your home's value as well as a comparison with similar homes in the area
Home Values in the Area
Average Home Value in this Area
Purchase History
| Date | Buyer | Sale Price | Title Company |
|---|---|---|---|
| Corbett Shane | $138,000 | Fireland Title | |
| Advanced Opportunities Inc | $85,100 | Clunk Hoose Co Lpa | |
| Jones Errol | $90,000 | -- |
Source: Public Records
Mortgage History
| Date | Status | Borrower | Loan Amount |
|---|---|---|---|
| Open | Corbett Shane | $138,000 | |
| Previous Owner | Jones Errol | $80,000 |
Source: Public Records
Tax History Compared to Growth
Tax History
| Year | Tax Paid | Tax Assessment Tax Assessment Total Assessment is a certain percentage of the fair market value that is determined by local assessors to be the total taxable value of land and additions on the property. | Land | Improvement |
|---|---|---|---|---|
| 2025 | $2,873 | $53,820 | $15,369 | $38,451 |
| 2024 | $2,873 | $53,820 | $15,369 | $38,451 |
| 2023 | $2,873 | $53,820 | $15,369 | $38,451 |
| 2022 | $2,578 | $40,601 | $11,554 | $29,047 |
| 2021 | $1,977 | $40,601 | $11,554 | $29,047 |
| 2020 | $1,962 | $40,600 | $11,550 | $29,050 |
| 2019 | $1,358 | $28,160 | $15,010 | $13,150 |
| 2018 | $1,163 | $28,160 | $15,010 | $13,150 |
| 2017 | $1,106 | $28,160 | $15,010 | $13,150 |
| 2016 | $1,193 | $27,050 | $15,010 | $12,040 |
| 2015 | $1,106 | $27,050 | $15,010 | $12,040 |
| 2014 | $1,099 | $27,050 | $15,010 | $12,040 |
| 2013 | $1,122 | $27,780 | $15,010 | $12,770 |
Source: Public Records
Map
Nearby Homes
- 75 Glenwood Cir
- 572 Eastglen Cir
- 462 Pickwick Ln
- 261 van Evera Rd
- 464 Carruthers Rd
- 926 Burbank Ave
- 1641 Slusser Rd
- 1623 Romona Rd
- 1530 Indianola Ave
- 93 Olalla Ave
- 500 Dottie Ct Unit 109
- 580 Elko Ave
- 486 Frazier Ave
- 2253 Tyro Ave
- 159 Waterford Way Unit 44
- 466 the Brooklands
- 853 Brittain Rd
- 1499 Huguelet St
- 469 Lodi St
- 605 Melrose St
- 69 Glenwood Cir
- 555 Narragansett Dr
- 561 Narragansett Dr
- 549 Narragansett Dr
- 567 Narragansett Dr
- 81 Glenwood Cir
- 21 Siebanoller Ct
- 132 Westwood Cir
- 543 Narragansett Dr
- 70 Glenwood Cir
- 573 Narragansett Dr
- 87 Glenwood Cir
- 537 Narragansett Dr
- 138 Westwood Cir
- 126 Westwood Cir
- 76 Glenwood Cir
- 93 Glenwood Cir
- 120 Westwood Cir
- 579 Narragansett Dr
- 88 Glenwood Cir